How Does Location Intelligence Transform Business Strategy?

Sep 04, 2024 / 3 min

How Does Location Intelligence Transform Business Strategy?

Blog

Technology is transforming the way companies are growing, especially through the use of location intelligence. At dataplor, we empower many of the world’s largest companies by delivering real-time, accurate location data. This valuable geographic information can be used to fuel advanced technologies and data systems across a number of industries.

By integrating diverse data sources into their business intelligence systems, companies can elevate their location analytics and data visualization capabilities. This enriched business data enables more effective marketing campaigns and resource optimization, ultimately leading to better decisions across the board.

What is Location Intelligence?

Location intelligence is gained by analyzing geospatial data collected from various sources like GIS, satellite imaging, drones, census reports, and more. While this process can be time-consuming and complex, dataplor simplifies it by streamlining the data collection and delivering relevant point-of-interest data directly to your business. With this information in hand, your data analysis team can easily identify marketing and retail opportunities as well as new possibilities across various industries.

Applications of Location Intelligence Solutions

Location data holds the key to unlocking smarter business strategies across various sectors, including retail, healthcare, real estate, insurance, and more. This data-driven approach facilitates informed decision-making and maximizes revenue through several use cases:

  • Mapping: Location intelligence enables GIS and other spatial data technologies to create intuitive dashboards and visualizations, helping to identify patterns and potential relationships within and between locations.
  • Site Selection: Insights from geographic data allow organizations to assess the pros and cons of potential real estate locations, optimizing their site selection for competitive advantage.
  • Competitor Investigation: Gain a deep understanding of the competition to identify market opportunities and areas to target.
  • Supply Chain Optimization: Use location data to optimize logistics, distribution, and inventory management.
  • Risk Assessment: Identify potential risks by considering factors like ROI forecasting and fraud prevention.
  • Customer Segmentation: Customize product promotions and offerings tailored to consumer demand based on location data. 
  • Real Estate Valuation: Determine property values based on location-specific factors like proximity to amenities, schools, and transportation.
  • Urban Planning: Forecast which areas are most likely to see substantial growth, and predict the best areas for development.

Comprehensive Location Insights From dataplor

As a leading provider of global location intelligence, dataplor utilizes advanced machine learning, image recognition, and artificial intelligence technologies to examine vast arrays of data across more than 250 million locations in over 200 countries and territories. This commitment to quality ensures that you can make well-informed, data-driven business decisions. Our international team of analysts and human validators leverage their local experience and language fluency to maintain high data accuracy, reduce errors, and identify duplicates in real-time.

Reach Out to Our Experts for More Information

Partner with a provider committed to giving you a competitive edge. dataplor is your global partner in location intelligence, helping your business optimize customer experiences, improve supply chain functionality, and enhance financial services through our accurate Point-of-Interest (POI) data. Our industry-leading quality control procedures ensure you receive highly accurate and relevant location data that you can trust. Contact our experts to learn how our data can strengthen your business strategy and support data science initiatives, urban planning, CRM, IoT applications, pricing strategies, and more.

Assessing the Impact of California’s QSR Minimum Wage Law: What the Data Reveals

Aug 27, 2024 /

Assessing the Impact of California’s QSR Minimum Wage Law: What the Data Reveals

Blog

After months of debate and anticipation, California’s minimum wage law for fast food workers, signed into law in September 2023, officially took effect in April 2024. This significant policy change, which raised the minimum wage for fast food workers to $20 per hour, sparked widespread concern about its potential impact on the state’s Quick Service Restaurant (QSR) industry. With predictions of a wave of closures as restaurants struggled to manage the increased labor costs, the question on everyone’s mind was: what has actually happened since the law came into force?

By analyzing our Point-of-Interest (POI) data, we’ve uncovered a nuanced picture of the situation. Our findings not only shed light on the impact of the wage increase but also reveal the broader economic forces influencing the industry.

Initial Impact: September 2023

When the QSR minimum wage law was signed in September 2023, the data showed a notable decrease in dining POIs in California— nearly three times greater than what was observed in comparable states. Specifically, the monthly percent change of dining closures in California in September 2023 was 71%, while similar states experienced only a 25% increase in closures. This sharp decline immediately raised concerns, suggesting that the new law might be having a swift and adverse effect on the industry.

ca1

However, it’s essential to place this data in context. Fluctuations in closure rates were already occurring before September, pointing to other underlying factors influencing the QSR landscape in California. For example, in May 2023, we observed significant variations in closure rates, which may have been driven by broader economic pressures such as the Federal Reserve’s rapid rate hikes, negative net migration, and local economic challenges. These factors suggest that the QSR industry was already navigating a complex economic environment, making isolating the wage law’s impact challenging.

Post-Law Implementation: 2024 Trends

As the minimum wage law took full effect in April 2024, many expected another sharp increase in QSR closures. Indeed, our data confirms this expectation: closures in California surged by 80% from March 2024 to April 2024, a stark contrast to the same period in the previous year, where closures decreased by 80%. However, this trend was not isolated to California; comparable states across the country also experienced a rise in closures during this period. This parallel suggests that broader national economic conditions, rather than the wage law alone, played a significant role in driving these closures.

ca2

Looking beyond the immediate impact, the data reveals that by late 2024, closure rates in California have begun to align closely with those in peer states. This trend indicates that while the initial shock from the wage increase was real, it may have been absorbed or overshadowed by other factors over time. This alignment suggests that the wage law’s impact must be viewed within the larger context of national economic trends that have influenced the industry as a whole.

Broader Economic Context

National economic factors, such as rising inflation rates and shifts in labor market conditions, have likely compounded the challenges QSRs faced in California and nationwide. For instance, the monthly change in closures from January to March 2024 was 124%, compared to an 89% increase during the same period in 2023. These figures highlight the significant influence of broader economic pressures, which may have had a more substantial impact on closures than the wage law itself.

Our analysis also reveals similar trends in other states that did not implement a wage increase, reinforcing that the broader economic environment played a crucial role in shaping the outcomes we observed. When comparing data from wage-increase states to those without such changes, it becomes clear that macroeconomic forces likely had the most significant influence on closure rates across the board.

ca3

The data shows that while California’s QSR minimum wage law had an immediate impact on the industry, the broader economic environment played the most significant role in shaping the trends we observed. The patterns in California mirror those seen across the country, highlighting that macroeconomic factors were the primary drivers behind the changes in the QSR sector. Despite the initial shock of the wage increase, restaurant employment in California is only slightly worse than in comparable states over the entire year. This underscores the dominance of more significant economic trends in determining the industry’s trajectory.

Looking Ahead

As we continue to monitor the impact of wage policies on industries like QSRs, it will be crucial to consider these findings within the broader economic context. Future research should focus on analyzing the long-term effects of these policies, as well as the influence of technological changes and other factors that may shape the industry’s future. 

Our data-driven analysis underscores the importance of understanding the complex interplay between policy changes and macroeconomic forces, providing critical insights for the QSR industry and policymakers as they navigate these challenges. Staying informed with up-to-date data will be key to making sound, strategic decisions.

Are you interested in learning more? Contact dataplor to connect with our data experts today.

Want to see how dataplor measures up?

Request Free Data Sample Talk to an Expert
cta-bg

Mapping POI Data Use Cases and Common Applications

Jul 31, 2024 /

Mapping POI Data Use Cases and Common Applications

Blog

As a geospatial developer, your customers rely on you to provide accurate, up-to-date maps they can use to find and understand specific locations. Learn some of the most important ways point-of-interest (POI) data is used in the GIS industry below.

6 Use Cases for Mapping POI Data

Creating accurate maps is vital for business continuity, financial health and more. Here are some of the top use cases for points of interest mapping across various industries.

1. GPS Systems

Now that almost everyone carries a smartphone, more people use global positioning systems (GPS) to get around than ever, and GPS companies rely on accurate map data to serve their customers.

Adding more data about specific places on a map, such as the following, makes it easier for people to find their way around new places:

  • Retail centers
  • Hospitals
  • Public parks
  • Government offices
  • Restaurants
  • Entertainment venues
  • Tourist attractions

This information also gives end users the ability to uncover hidden places within their communities, which improves the customer experience and opens them up to new adventures.

2. Ride-Booking and Transportation

Both ride-booking services and public transportation organizations rely on GPS data to get customers to their destinations on time. When that data doesn’t reflect changes in an area, it becomes difficult to provide the level of service people expect.

Digital maps containing the most up-to-date POI data help these companies by:

  • Reducing errors like missed turns.
  • Helping drivers avoid areas prone to traffic jams.
  • Boosting company reputation and enhancing customer experiences.

3. Urban Planning and Real Estate

Construction and real estate companies need to monitor trends in population and business movement to predict which areas are most likely to experience significant growth.

Digital mapping applications that include POI data provide these companies with important information such as:

  • Which brands are setting up in an area.
  • Which specific demographics these brands attract.
  • What kinds of architecture are already in an area.

This research can help developers and real estate firms determine the best places to build and how they can make new structures blend in with their surroundings.

4. Logistics and Supply Chain Optimization

Data-driven decision-making is essential for mitigating risks and improving operational efficiency. Here’s how a POI map can help third-party logistics companies and supply chain risk managers:

  • Optimize route planning: Employees can use your maps to plan the most efficient shipping routes and itineraries, which can help them improve their on-time delivery rates.
  • Analyze local markets: Knowing where competitors and other local businesses are located can help supply chain companies decide where to set up new facilities.
  • Improve risk management: An up-to-date view of all the potential risks a driver might encounter on a job can help risk managers boost safety and minimize losses.

5. Gain a Competitive Advantage

The navigation and mapping space is highly competitive, and standing out from the industry front runners is one of the best ways to boost profitability. One way to differentiate your business is to provide more accurate data.

When customers can reliably navigate new places and find the information they’re looking for from a map company, they’re more likely to choose that company again.

6. Cost Savings

Powering GIS platforms with bad data can result in costly errors, especially for companies that require real-time location updates. POI data in digital mapping can help your customers boost their profitability by:

  • Reducing refunds: When customers don’t get their products on time, they’re more likely to cancel the requested service or ask for a refund. POI maps enable highly accurate route optimization, which significantly lowers the risk of refunds cutting into the company’s cash flow.
  • Streamlining resource allocation: Businesses can use POI-based maps to improve their budget allocations based on local performance, population data and more. 
  • Improving customer targeting: Geofencing and other location-based marketing tactics only work when they have accurate information to go off of. Providing up-to-date POI data enables marketing teams to reduce the risk of losses due to ill-informed campaigns.

How to Find Good POI Mapping Datasets

Maps with point-of-interest data are essential for many business decisions. The challenge is finding a reliable source of quality POI data, especially when most open-source datasets are riddled with errors. Here’s what to do when choosing a data provider:

Consider Your Goals

To make your investment worthwhile, you need to have a clear idea of what you want to do with this data. Which datasets do you need to achieve these goals, and do you need more than POI data?

Understanding what a dataset can and can’t tell you is essential for making an informed investment. By comparing a company’s offerings against your goals, you can determine what level of coverage you need.

Request a Data Sample

Free data samples are often a sign of a reliable company, as they provide clear evidence of the data’s accuracy and reliability. Reach out to your chosen data provider to request a sample of their data and test it in experimental applications. Is it accurate? Does it serve your purposes? 

If you have any questions about the data, its sources or how the company validates it, feel free to contact a representative for more information.

Evaluate the Source

Before signing on with a data provider, it’s important to make sure they’ll be a suitable partner. These criteria can help:

  • Wide coverage: Look for a provider that offers global coverage to ensure you have the data you need for every location you need to map.
  • Flexible licensing: A flexible licensing plan ensures you only pay for the data you use, improving your return on investment and preventing information overload.
  • Verification: Does the provider manually verify their data with human experts, or do they rely on their technology to do all the work? Human confirmation is essential for ensuring you have the most accurate data available.
  • Dynamic updates: Your provider should update data frequently to reflect changes in an area, such as business relocations and new construction. A provider that offers near-real-time updates is ideal.

Enhance Your Mapping Accuracy With dataplor

If you’re looking for a source of POI data you can trust, dataplor is here for you. Our proprietary AI-based technology allows us to rapidly edit our datasets any time an area experiences changes, enabling near real-time updates on locations around the world. Our in-house team of data analysts reviews all our datasets before publishing, so you can count on us to provide the most accurate data at any given time.

See how our proprietary methods can help your company scale operations, enhance revenue and provide better service to your customers. Contact us today to request your free data sample.

European Trends in Tourism (and Tourism-Adjacent) Businesses

Jul 25, 2024 / 5 min read

European Trends in Tourism (and Tourism-Adjacent) Businesses

Blog

After several dispiriting years of pandemic-related travel restrictions, tourism in Europe is back in full swing and booming more than ever this summer. With the revival of this important economic sector, local businesses in tourism-focused industries such as dining and hotels are experiencing significant growth. The European Travel Commission estimates that tourists will contribute a record €800 billion to Europe’s economy this year—a 37 percent increase over pre-pandemic levels.

While the surge in visitors is not without controversy for the countries hosting them, the influx of tourists is undeniably revitalizing the tourism sector in ever-popular destinations such as London, Paris, and Rome, as well as emerging hotspots in southern and eastern Europe. 

This raises the question: what does the economic boom look like on the ground? By analyzing our Point-of-Interest (POI) data, we’ve uncovered trends in business growth across the region, particularly in Paris. The city is currently welcoming athletes, their families, and fans from around the world for this year’s Summer Olympic Games. 

Regional Trends To Watch

The highest growth percentages in the total number of business locations since 2023 paint an interesting and dynamic picture of recovery. Which regions ended up at the top of the lists? For our analysis, we categorized European nations as follows:

  • Northern Europe: Norway, Sweden, Denmark, Finland, Iceland, United Kingdom, Ireland
  • Western Europe: Austria, Belgium, France, Germany, Liechtenstein, Luxembourg, Monaco, Netherlands, Switzerland
  • Southern Europe: Andorra, Italy, Malta, Portugal, San Marino, Spain, Vatican City
  • Eastern Europe: Belarus, Bulgaria, Czech Republic, Hungary, Moldova, Poland, Slovakia, Ukraine
  • Southeastern Europe: Albania, Bosnia and Herzegovina, Bulgaria, Croatia, Greece, Kosovo, Montenegro, North Macedonia, Romania, Serbia, Slovenia

Across Europe, three regions lead in the growth of new restaurant and bar openings: Western Europe, Eastern Europe, and Southeastern Europe. This surge likely reflects tourists’ desire for diverse culinary experiences while traveling abroad. These same three regions also top the list for new bar openings, highlighting their vibrant nightlife and social scenes, which attract both locals and tourists.

In the travel sector, including hotels and tourism agencies, the most significant growth has occurred in Western Europe, Southern Europe, and Southeastern Europe, demonstrating a strong rebound in the hospitality industry. The influx of tourists to these regions has also driven the highest growth in transportation, underscoring the need for efficient and expanded transit options for visitors. 

As for shopping, new retail businesses have flourished in Western Europe, Southeastern Europe, and Southern Europe, driven by increased tourist spending. The entertainment and recreation sector has experienced the highest growth in Western Europe, Southern Europe, and the Nordics, reflecting a higher demand for a variety of leisure activities in those areas.

Hot-Off-the-Press Country Trends

What does the data tell us about the tourism recovery landscape at the country level and its impact on local economies? Let’s examine the growth of tourism-focused businesses across various European nations.
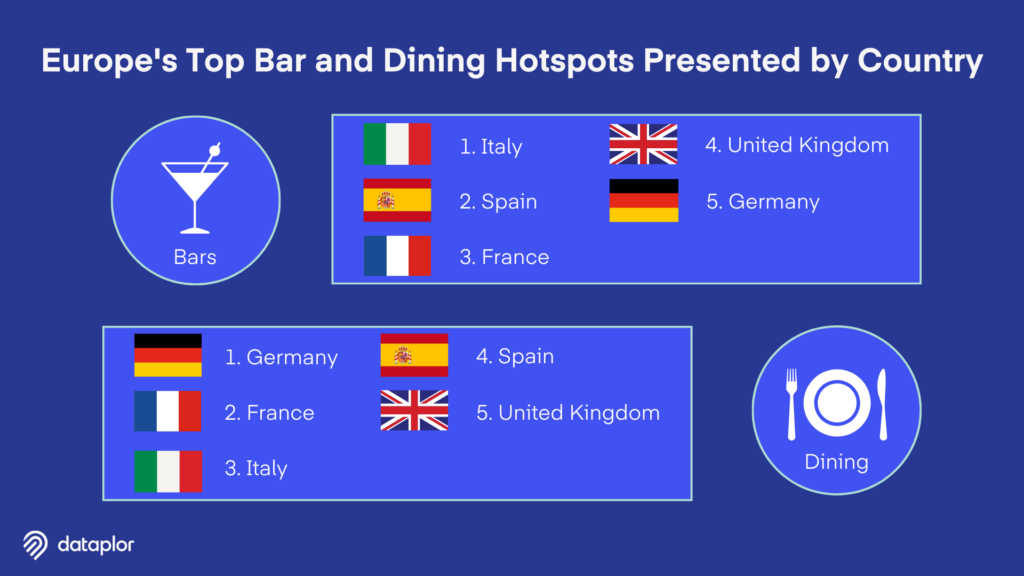
Bar and Dining Infographic

If you’re curious about the latest trends in the European dining and bar scenes, Serbia, Italy, and the Netherlands are leading in new restaurant openings, followed closely by Ukraine, Germany, and France. Serbia, Italy, and the Netherlands are at the top for new bar openings, with Belgium, Ukraine, and France seeing significant growth in places to enjoy a drink with friends and locals. 

As expected, the enormously popular tourist destinations like Italy, France, and Greece are at the forefront of travel-related business growth. Italy and Serbia lead in the transportation sector’s growth, followed by Belgium, the Netherlands, and Greece.

Retail business growth has been most notable in Serbia, the Netherlands, and Italy, followed by France and Germany, where tourists’ shopping habits are undeniably contributing to the sector’s expansion. Finland, the Netherlands, and France lead in entertainment and recreation business growth, with Italy and Serbia also seeing increases. These countries, already popular with tourists, are enhancing their appeal by offering a wide range of recreational activities to tourists.

Where to Find the Most Bars and Restaurants

For travelers seeking the most diverse and vibrant bar scenes in Europe, Italy, Spain, and France are top destinations for raising a glass, followed closely by the United Kingdom and Germany. If dining out is a top priority while on vacation, Germany, France, and Italy offer the most restaurant options, while Spain and the United Kingdom are next in offering visitors a rich array of culinary options.

Spotlight on Paris

Paris is in full hosting mode for the 2024 Summer Olympics, which is already having a significant impact on tourism-related sectors.
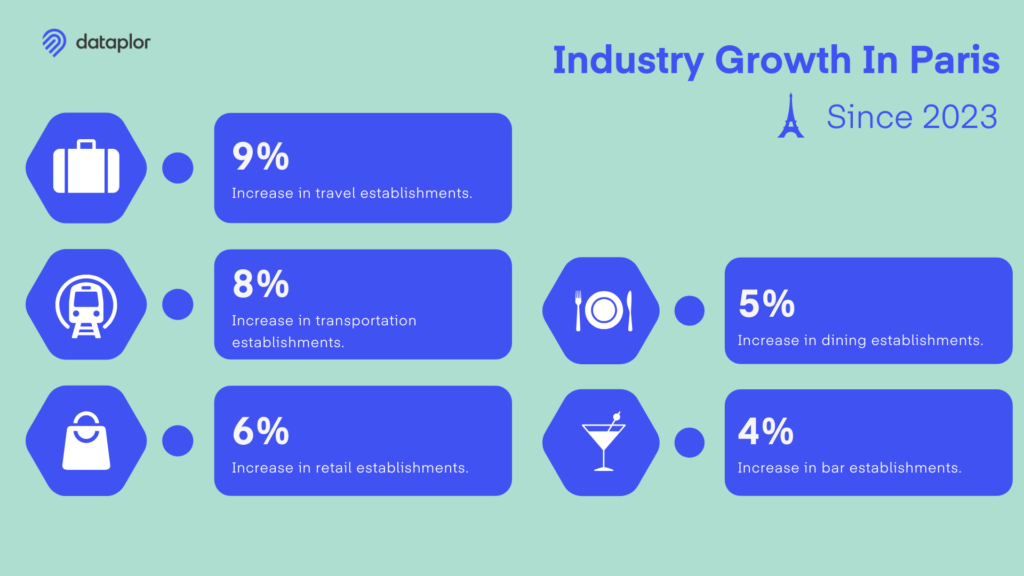
Industry Growth Infographic

Out of all the travel POIs, which pinpoint businesses such as lodging and travel agencies, 9 percent have opened since 2023, marking the highest number of recent openings in any category. The transportation sector has also seen substantial growth, with 7 percent of new openings in relation to other categories, reflecting preparations for the influx of visitors for the Games. Dining establishments have seen 5 percent of openings relative to other areas, and the number of bars has accounted for 4 percent of new openings, giving visitors more options for meals, aperitifs, or late-night celebrations of Olympic victories. Finally, Paris’s retail footprint accounted for 6 percent of openings, as the city strives to meet tourists’ insatiable appetite for shopping in the City of Light.

A Glimpse into the Future

As the data clearly shows, the resurgence of European travel is fueling significant growth across multiple tourism-related business sectors. The increase in business locations, particularly in dining, bars, travel, transportation, retail, and entertainment and recreation, highlights these industries’ ability to bounce back and thrive after extremely challenging times.

Paris, with its preparations for the Summer Olympics now coming to fruition, provides an excellent example of how major events like the Games can accelerate growth in tourism-adjacent businesses. These trends not only reflect the current state of the tourism industry in Europe, but also indicate a future where travel and tourism continue to play a vital role in Europe’s economic landscape. As the tourism sector evolves, paying attention to these trends will become increasingly important, providing crucial insights into where people are headed and how businesses can adapt to meet their needs.

Want to see how dataplor measures up?

Request Free Data Sample Talk to an Expert
cta-bg

Retail POI Data Use Cases and Common Applications

Jul 16, 2024 /

Retail POI Data Use Cases and Common Applications

Blog

According to real estate experts, location is everything. And this phrase is just as true for retail as it is for the real estate industry. 

Data-driven decision-making is essential for making sure you’re positioning your business for success. Whether you’re looking to expand your presence abroad or begin opening new stores domestically, global point of interest (POI) data and analytics are essential tools for making the right geographical decisions for your company.

Let’s explore some of the most common use cases and applications for retail datasets. 

What Is Retail POI Data?

Point of interest data is information about a specific physical location. A POI can be any location someone finds interesting, such as a retail store, hospital, restaurant or grocery store.

4 Use Cases for Retail Location Data

Businesses can use data in many creative ways, but here are the top four use cases for retail companies.

1. Selecting a Store Location

When expanding your business or moving your store to a new area, you want to make sure you’re setting up shop in a profitable location. Retail store location data can help you choose the ideal spot.

Site analysis can help you evaluate whether a site is right for your business based on factors like:

  • Competition: One of the most important parts of a site selection analysis is making sure you’re not moving into an area that already has a high concentration of competitors in your sector.
  • Nearby businesses: POI data can help you understand what businesses outside your sector your target demographic likes to visit and how far they are from your location.
  • Residential areas: Having residential neighborhoods near your chosen location could help you attract customers who don’t want to go too far from their homes to shop.

Ultimately, the goal of site analysis is to find a location that has a sizable population of your target customer base with few competitors.

2. Analyzing Competitors

Competitor analysis is vital for getting a leg up over the competition in a specific location. Some important questions POI data can answer include:

  • What about your competitors’ physical stores is attracting your customers? 
  • Are they in a good location with supporting businesses nearby? 
  • Is their store near a residential or commercial hub? 
  • Do they advertise well to the customers in the area? 
  • How many of your other competitors are close by?

The more you know, the easier it will be to determine where you need to stake your new location.

3. Enhancing the Customer Experience

POI data is a great tool for gaining insight into customer preferences and behaviors. 

Retail store location data can help you provide a more fulfilling customer experience at existing and new locations by:

  • Navigation: Customers should be able to find and travel to your store quickly and easily. POI data can help you choose a convenient, highly visible location within a short distance of your target market, or other businesses they frequent.
  • Geotargeted marketing: Accurate, up-to-date location intelligence enables you to take advantage of cutting-edge advertising techniques that appeal specifically to customers in an area. 
  • Location trends: Where do your customers prefer to spend their time? What hot businesses are in your area? POI data can help you leverage these insights to keep your target market engaged.
  • Region-specific offerings: Understanding your customers is essential for effective localization. This information can help you tailor product and service offerings for each country you operate in, appealing to local tastes and meeting customer demand.

4. Optimizing the Supply Chain

Thanks to e-commerce pioneers like Amazon, customers now expect to receive deliveries in just a few days.

POI data can also help you leverage your geographical location to shorten lead times and improve order fulfillment for customers living nearby. If you’re trying to decide where to put a distribution center, warehouse or other logistical facility, a thorough site analysis using retail POI data can help. 

For example, an e-commerce company could use retail POI data to find an ideal lot for a warehouse that’s close enough to the business’s target market to meet customers’ increasingly high expectations. 

Additionally, POI data that updates in real time can enable your company to provide customers with live order tracking. Customers can rest assured knowing valuable purchases are safe and on the way, which is one of the best ways to improve the delivery experience.

Finding Good Retail Datasets: Tips and Tricks

When buying POI data, you must ensure that the dataset is accurate and well-maintained. Here are some tips you can use to find the best data for your intended application:

  • Check for data quality: Request a free sample from your data provider to make sure the dataset is complete, current and accurate. If you have any questions, reach out to the provider’s customer service department for more information.
  • Make sure it offers wide coverage: Whether you’re looking to expand internationally or gather intelligence on your nearby competitors, you’ll need to ensure the datasets you use cover the areas you need. 
  • Ask about licensing terms: Your data needs will vary depending on your intended use case, so it’s important to make sure you’re only paying for the data you use. A provider that offers flexible licensing plans can help you ensure your investment aligns with your goals.
  • Choose a trustworthy provider: While open-source data sets are more cost-effective, they’re often riddled with errors and outdated data points. Instead, look for a paid data provider that updates their data in real time to ensure you always have access to the most recent information.

If you’re looking for a dynamic, cost-effective and accurate source of high-quality POI data for retail stores, dataplor is the data provider for you.

Get Quality POI Data for Retail Stores From dataplor

The right data makes an enormous difference in the success of your business. Working with a reliable POI data provider is the only way to get the data you need without worrying about inaccuracies.

At dataplor, we combine powerful AI capabilities with an international team of human validators to ensure your retail location data is always accurate and up to date. Our data covers more than 200 countries and territories worldwide, so you can gain insight into points of interest virtually anywhere on Earth.

Contact us today to speak with one of our experts or request a free data sample to see how dataplor can help you reach your business goals.

Third-Party Logistics POI Data Use Cases and Applications

Jun 28, 2024 /

Third-Party Logistics POI Data Use Cases and Applications

Blog

Third-party logistics (3PL) businesses can reap many benefits from leveraging points-of-interest (POI) data. Industrial POI sites include manufacturing plants, warehouses, factories, distribution centers, power plants and refineries, among other facilities. 

Access to comprehensive POI data can transform and revolutionize your daily operations, helping your business verify its partners and optimize its planning to streamline logistics. These insights also enable 3PL companies to cut costs and deliver outstanding customer service, supporting greater satisfaction and ultimately protecting your bottom line. 

Explore some key use cases for POI data in the 3PL industry. 

7 Use Cases for 3PL POI Data

Industrial POI datasets include a wide range of valuable insights, including but not limited to site coordinates, names, addresses, size, capacity and operational status. 3PL businesses and researchers can leverage this data to enhance operations.

Explore some key applications of POI data for logistics companies.

1. Optimizing Route Planning

Points-of-interest data is an incredible tool for 3PL companies looking to optimize route planning. Some of the key insights used to determine the most advantageous and time-saving route include:

  • Customer locations.
  • Traffic patterns.
  • Traffic congestion.
  • Delivery constraints.

This information enables your business to create highly efficient delivery routes. By carefully planning which directions your drivers take and finding the path of least resistance, your third-party logistics company can save significant costs thanks to factors like reduced fuel consumption and overall efficiency. 

Plus, you can support shorter delivery times and boost customer satisfaction. Having POI data tools that provide updates in real time is also highly advantageous, especially for adjusting driving routes in response to changing road conditions to remain on schedule and combat frustrating delays. 

2. Geofencing and Location-Based Services

Third-party logistics businesses can also utilize geofencing and location-based services to supercharge route planning and enhance operational visibility to support better overall asset and resource management.

Geofencing refers to a technology that allows users to establish virtual boundaries around physical locations. Your 3PL company can set up geofences around POIs, like your distribution center or warehouses, to track the following in real time:

  • Shipments
  • Arrivals
  • Departures 

You can leverage these tools to receive automated notifications based on driver proximity to different locations, increasing visibility into your operations. 3PL businesses can capitalize on location-based services powered by points-of-interest data to personalize and enhance customer experiences through:

  • Tailored recommendations.
  • Optimized service deliveries. 
  • Enhanced delivery insights.
  • Targeted engagement.

3. Market Analysis

POI data is an incredible tool for third-party logistics companies looking to perform an extensive market analysis to learn more about current market trends, customer behavior and competitor strategies. Your business can use POI insights in its market analysis to:

  • Identify market demand: Analyzing POIs can help you determine which regions feature the highest market demand for your logistics services.
  • Assess competitor locations: Your business can utilize POI data to better understand competitive dynamics and establish strategies to differentiate your services from others in the market. 
  • Optimize network design: POI data can help your 3PL company determine the best transportation networks to supercharge efficiency, cut unnecessary costs and enhance service coverage. 
  • Demand forecasting: Historical points-of-interest data can offer a glimpse into the future, helping your business anticipate market demand for logistics. 
  • Expansion opportunities: POI data also give 3PL companies insight into opportunities for expansion based on factors like gaps in existing logistics infrastructure and historically underserved regions. 

4. Risk Management

Third-party logistics businesses can also leverage POI data to boost risk management in their operations. Points-of-interest insights help companies identify, assess, manage and mitigate various risks. 

By analyzing the regions around key POIs, your company can assess supply chain vulnerabilities and high-risk areas that could negatively impact operations, such as severe weather, high theft rates or geopolitical events.

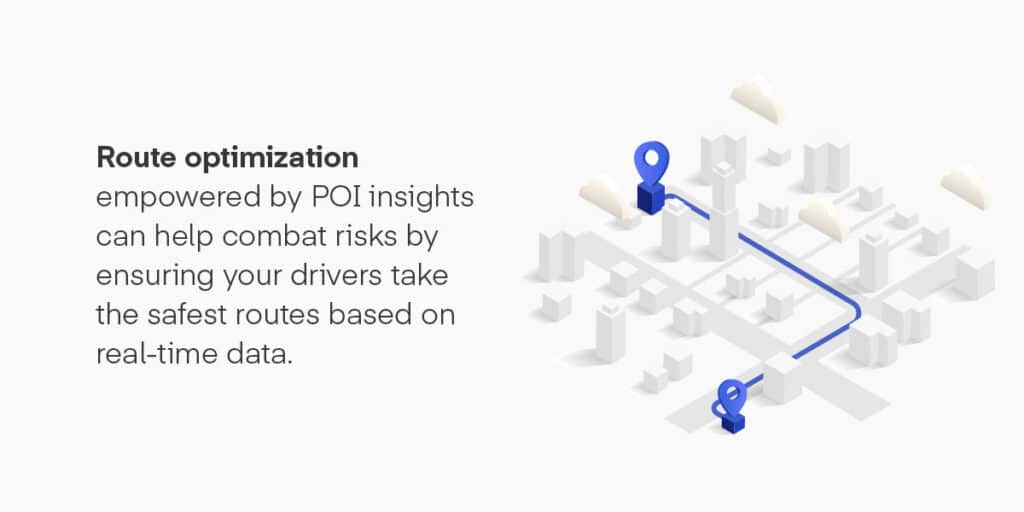
Route optimization empowered by POI insights can help combat risks by ensuring your drivers take the safest routes based on real-time data. 3PL companies also use POI data to monitor vehicle movement, ensure regulatory compliance and determine tailored insurance coverage based on area-specific risks. 

5. Customer Segmentation

Points-of-interest data also allow 3PL businesses to segment their customer base to increase their understanding of their target market’s behaviors, preferences and needs. This enables you to better serve your customers and drive growth.

Segmenting helps businesses tailor their logistics services to meet customers’ unique needs. You can determine which level of service they require, such as:

  • Standard shipping.
  • Special handling.
  • Expedited delivery.

POI data offers valuable insight into delivery points, transportation hubs and distribution centers. This information, paired with predictive modeling tools, can help your company accurately anticipate customer behavior and future logistics needs. Taking a proactive approach to customer segmentation can help you meet changing customer demands and remain competitive in your market.

6. Supply Chain Management

3PL POI analytics can completely transform your business’s supply chain management strategy. After a few turbulent years for the global supply chain, third-party logistics businesses learned the value and importance of taking a data-backed approach to mitigating risks and optimizing operations. 

By closely analyzing POI data, 3PL companies can determine an optimized network design and align inventory with customer demand patterns. Access to real-time POI insights on shipment statuses, vehicle locations and potential delays can help your business make more informed decisions and proactively respond to disruptions, minimizing their impact on your customers.

7. Last-Mile Delivery Optimization

The final stage of the delivery process is integral to supporting optimized efficiency and operations. POI data and real-time tracking solutions help 3PL businesses determine the best possible routes to ensure timely delivery. These insights allow your business to share accurate estimated times of arrival for deliveries to your customers, considering factors such as customer locations, distance from POI and traffic conditions.

Consumers have high expectations, especially for last-mile delivery services. They expect communication and convenience regarding their deliveries. POI insights enable your company to minimize travel time and guarantee more on-time deliveries to boost satisfaction. 

Contact dataplor to Leverage Location Intelligence for 3PL

If your business is looking to take advantage of POI data to supercharge your third-party logistics services, turn to the products from dataplor. 

With dataplor’s global geospatial data, you get access to valuable real-time insights about everything from local manufacturers to optimal distribution routes. Third-party logistics companies can strategically supercharge operational efficiency and enhance their bottom line. Our POI data offers comprehensive location intelligence so you can make informed decisions, improve resource allocation and cut unnecessary spending.

Are you ready to get started? Contact dataplor to speak with one of our data experts today.

CPG POI Data Use Cases and Common Applications

Jun 20, 2024 /

CPG POI Data Use Cases and Common Applications

Blog

Point-of-interest (POI) data refers to a type of geospatial data that offers valuable insight into customer behavior. A POI can be any location, such as a business, attraction or facility, that may be of interest to a particular consumer, brand or decision-maker. Consumer packaged goods (CPG) companies can leverage POI data to supercharge their operations and foster greater scalability. 

POI data amplifies your CPG strategy by helping your business drive informed decision-making based on location-specific consumer insights. Explore how to use POI data for the CPG industry below.

7 Applications of CPG POI Data

POI data offers a look into the minds of consumers and what destinations they find appealing, and there are many ways for businesses to capitalize on these insights. Check out these advantageous CPG POI data use cases below:

1. Effective Market Analysis

Consumer packaged goods companies can utilize POI data to conduct a more comprehensive market analysis that encompasses key locations, such as retail stores, supermarkets, distribution centers or malls. Your business can use these insights to identify trends and gaps within your designated market. 

With greater awareness of the current market and customer preferences, your business can better understand where the greatest market opportunities are worldwide and where it is most beneficial to invest your time and money.

You can save valuable time and resources by diligently scouring POI data and using your findings to inform future decision-making before expanding your offers or trying to get your products in a new store. 

2. Targeted Marketing Efforts

Businesses can benefit from exploring both POI data and other CPG data sources, such as sales and social media insights, to inform their marketing efforts. 

POI data offers unparalleled insight into popular destinations and venues where your target consumers are spending their time and money. Getting to know your target market better through these metrics and segmenting that audience helps you cater to their unique wants and needs as a business. 

CPG brands can leverage POI data to deliver more personalized content, advertisements and product recommendations to the right consumers based on their preferences and behaviors in specific areas. 

Learning more about where your target consumers frequent can supercharge the impact of your brand’s marketing initiatives and campaigns.

3. Optimized Distribution Strategies

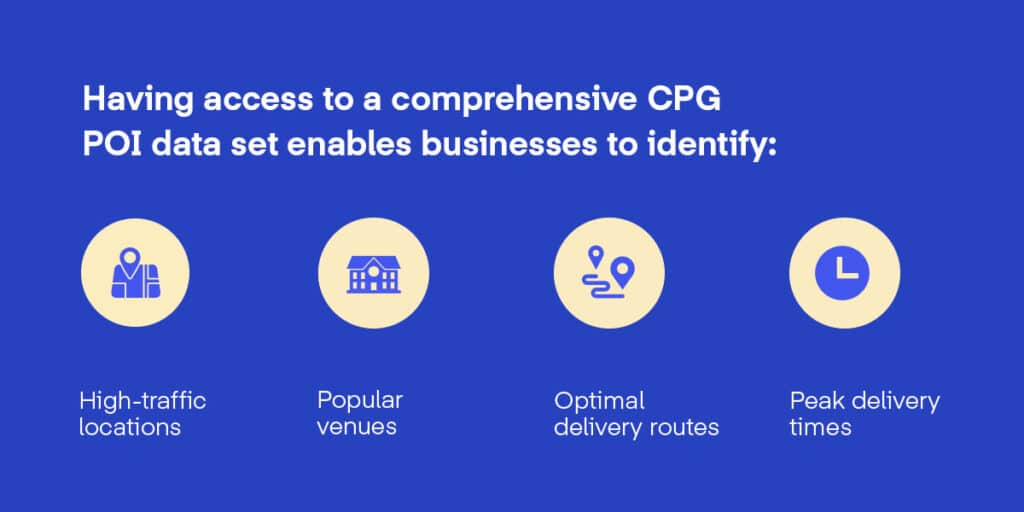
CPG brands can experience many unique challenges when looking to reach new audiences in different locations to expand their distribution. Having access to a comprehensive CPG POI data set enables businesses to identify the following:

  • High-traffic locations
  • Popular venues
  • Optimal delivery routes
  • Peak delivery times 

These insights are highly valuable for determining strategic and informed distribution plans that empower optimal efficiency, reduce distribution costs and ensure your business is meeting target consumers in places where they are already spending their money. 

By improving these logistical processes, brands can also foster optimized supply chain management, supporting greater scalability and long-term growth. POI data can help you avoid spending money on distribution to locations where your target customers are not currently exploring, saving time and resources you can invest in getting your products in the right locations instead.

4. Comprehensive Competitor Analysis

Point-of-interest data can also be highly beneficial for conducting a comprehensive competition analysis in the consumer packaged goods industry. Your brand can explore valuable insights about their competitor’s distribution strategy, such as:

  • Store locations
  • Market presence
  • Consumer reach
  • Plans for expansion

Gathering insights about competitor brands is easier than ever with the help of advanced technologies, like artificial intelligence, that can collect and analyze data more accurately and efficiently than a human. 

With a greater understanding of your competitors, your business can effectively identify opportunities for improvement and the tactics that give you a competitive edge in your specific industry.

POI data also enables CPG brands to determine where there are gaps in the market and the destinations where their products can shine.

5. Accurate Sales Forecasting

Another key application of consumer packaged goods POI data is effectively predicting future sales. By closely analyzing the location-specific insights from POI data, businesses are better able to predict demand, adjust inventory levels and optimize production.

With more accurate forecasting capabilities, your brand can anticipate consumer needs, make strategic decisions to foster greater satisfaction and protect your bottom line. 

When your company knows what to expect from consumers, it can deliver the right products at opportune times in the most profitable locations.  

In addition to informing resource allocation and saving your brand significant costs, accurate forecasting can help your business identify new opportunities for growth and mitigate potential risks.

6. Enhanced Merchandising and Assortment Planning

Point-of-interest data also helps consumer packaged goods brands optimize their merchandising and assortment planning strategies. Your business can analyze POI data to gain a more in-depth understanding of your target consumer’s preferences and shopping patterns at various locations. Using these insights, your company can then tailor the available product assortments and placements to optimize sales. 

Brands can also leverage POI data to determine which promotional strategies are most advantageous for meeting consumer wants and needs in different locations. 

POI insights offer direction for product selection, placement, price and promotion. Tailoring your merchandising tactics to the point of interest can help your business optimize its in-person presentation to supercharge sales.

7. Strategic Product Launches

Finally, you can also leverage CPG POI data to identify key locations for new product launches. If your business is interested in testing ideas and seeing how different merchandise performs, paying attention to POI insights can help you determine where to sell your latest goods to gain product exposure and boost initial sales. 

Analyzing this data can help consumer packaged goods brands strategically approach new launches in the destinations where they are most likely to perform well and reach the intended consumer. 

Kickstarting the sale of brand-new items in the wrong locations can cost your business in the long run. POI data gives you a holistic view of the market so you can set your product launches up for success and work off that momentum to drive revenue.

Contact dataplor to Start Leveraging Location Intelligence Across the World

If you’re looking to maximize the use of POI data for your consumer packaged goods brand, turn to dataplor. We can help you take advantage of robust artificial intelligence-driven resources and location-based insights from hundreds of locations in real-time.

dataplor helps businesses identify new opportunities to supercharge growth and achieve new levels of success with unmatched global POI datasets. We offer the most comprehensive data available to help your brand increase sales, outdo the competition and make smarter, data-backed business decisions.

Are you interested in learning more? Contact dataplor to connect with our data experts today. 

Retail’s New Frontier: The Rise of Store Openings in Smaller Cities and Counties

Jun 04, 2024 /

Retail’s New Frontier: The Rise of Store Openings in Smaller Cities and Counties

Blog

Many have wondered in recent years whether retail is experiencing a slow demise at the hands of online shopping. We took a look at some data to explore this question, and found a few interesting links between consumer trends and population migration. What does this tell us about the types of changes that are underway in retail?

We’re seeing an expansion boom among more affordably priced stores like Burlington and Marshalls, and a trend of new store openings across the board in smaller cities as opposed to major metropolitan areas. It’s clear that location is key: while stores have closed, a closer look speaks to a repositioning of many brand footprints. Let’s drill down into what’s happening and what it all means.

Where Have All the Shoppers Gone?

While the shift to online shopping during the pandemic caused some anxiety in the retail sector, in-person shopping has not only rebounded—it appears to be thriving. Across seven brands studied—Bloomingdale’s, Saks Fifth Avenue, Nordstrom, Macy’s, Marshalls, Kohl’s, and Burlington—there were approximately 380+ store openings from 2020 to the present. The store growth rates appeared to peak in 2022 and were followed up by a leveling-off in 2023. 

The seven brands studied opened approximately 380+ stores since 2020 (data visualization built with Carto).

The question: where, exactly, are shoppers going for these in-person experiences? And what are they looking for? 

The Answers Are In the Data

Consumers want to shop at stores that carry quality, trusted brands while not spending more—or traveling farther—than they have to. As a result, retailers are responding to demand for more budget-conscious shopping options. Burlington opened the most stores out of the seven studied during the 2020-present period, with roughly 281 store openings during that time, followed by Marshalls with about 64.

Next, we can see that store openings have been concentrated in suburban locations as opposed to major cities. The data reveals roughly 330 store openings in smaller cities and suburban areas, compared to about 59 openings in major cities (population above 600,000). With the success of these store openings in suburban locations, we can conclude that consumers want in-person shopping experiences—without breaking the bank—in the places they live. And retailers have been paying attention.

The Brand Follows the Consumer

As they say, the brand follows the consumer, and consumers have been on the move. This trend has informed a broader strategy by retailers to tap into emerging markets with growing consumer bases. While several major cities have seen lower rates of population loss over the past four years, and in some cases have even rebounded slightly since 2020, much of the population growth in the U.S. has been concentrated in lower-density outer suburbs.1

Our data indicated 330 openings in suburban areas and 59 openings in major cities from 2020 to today (data visualization built with Carto)

With more people living (and likely working from home) in areas outside of large metro centers, retailers are seeing a ripe opportunity to open new stores in the places where people now live. While some shoppers may still enjoy visiting a flagship store in a major city where they can have a unique experience, they also value time and convenience, a need that retailers are responding to with success.

Location Data: The Key to Business Strategy

It’s clear that location data is crucial to driving growth opportunities, cutting out guesswork and giving retailers a competitive edge. With access to accurate, nearly real-time POI location data, retailers can gain insights into customer trends and develop strategies based on that data. With a finger on the pulse of consumer trends, retailers can meet shoppers where they are while staying ahead of the game.


With dataplor, you’ll get the right insights. Learn more about our dynamically updated location intelligence here.

  1. Source: “New census data hints at an urban population revival, assisted by immigration,” by Robert Frey, The Brookings Institution, April 2024 ↩︎

How Wolt Strengthened Their Selection Insights with dataplor

Apr 25, 2024 /

How Wolt Strengthened Their Selection Insights with dataplor

Case Studies

Wolt’s Geospatial Evolution with dataplor

Wolt, a leading food delivery and technology company spanning 27 countries, initiated a transformative journey to enhance its market presence and identify untapped areas of opportunity. This case study explores why Wolt chose to partner with dataplor over other providers, the problems they sought to solve, and the remarkable accomplishments they’ve achieved through this partnership. Additionally, we delve into their future plans for innovation with dataplor.

Why dataplor?

Wolt’s decision to partner with dataplor was driven by their commitment to data coverage. They prioritized crucial factors such as the breadth of coverage, data accuracy, attributes and most importantly, data quality. dataplor surfaced as the top selection due to its ability to capture a vast number of Points of Interest (POIs) accurately and comprehensively. Wolt underwent an extensive evaluation process, exploring various data vendors. However, dataplor’s unmatched coverage and quality positioned it as the undeniable winner.

The Problems to Solve

Wolt aimed to leverage the data to enhance its market understanding and improve internal operations. They sought to evaluate data beyond their existing data sources to gain a more comprehensive view of merchants across various sectors, not just limited to restaurants. With dataplor, Wolt could address market gaps and identify untapped opportunities more effectively.

How Wolt Uses the Data Internally

Internally, Wolt extensively utilizes dataplor’s data to strengthen its competitive positioning and identify new opportunities. They integrate this data into their internal systems, serving it to Customer Relationship Management (CRM) platforms and ingesting it into various geospatial platforms. Wolt emphasizes the importance of data quality, recognizing it as the foundation for their operations. Centralizing processes enables Wolt to allocate resources efficiently, prioritize leads based on internal valuation, and enhance the accuracy of their predictive models.

Achievements with dataplor Data

Wolt’s collaboration with dataplor has yielded significant achievements. By leveraging dataplor’s comprehensive POI data, Wolt has improved its ability to serve customers and accelerate its growth in various markets. The integration of dataplor’s data has expanded Wolt’s market by nearly 40% in certain markets surpassing their initial projections. Wolt now possesses a more accurate and detailed understanding of merchants within their countries, enabling them to make informed decisions and capitalize on market opportunities effectively.

Background of Wolt’s Geospatial Focus

Leading Wolt’s geospatial initiatives, Sharat Ramamani brings a diverse background in strategy and analytics to the table. His journey into the geospatial realm began at Doordash, where he focused on new country expansion and selection. Following Doordash’s acquisition of Wolt, Sharat shifted his focus primarily to Wolt’s selection strategy across their 25 markets. Despite the challenges of navigating the early geospatial SaaS landscape and the initial learning curve, Sharat found the transition fruitful. Leveraging geospatial data has accelerated Wolt’s decision-making processes and accelerated their time to market.

Wolt’s strategic partnership with dataplor has transformed its approach to market development and expansion. By prioritizing data quality, accuracy, and innovation, Wolt is poised to continue its trajectory of growth and success, leveraging dataplor’s invaluable contributions to drive informed decision-making and capitalize on market opportunities effectively.

Join us on May 16th at the SDSC Conference in London, to hear from Wolt’s Analytics Lead, Sharat Ramamani and dataplor’s Enterprise Account Executive, Meagan Vigil firsthand.

Open-Source Data vs. a Paid Data Provider: Which Is the Better Option?

Apr 24, 2024 /

Open-Source Data vs. a Paid Data Provider: Which Is the Better Option?

Blog

Data is one of the most valuable commodities in business today, and open-source data is one of the easiest ways to get the information you’re looking for. But is free really better when it comes to data? When compared to paid data, open-source data may seem like the biggest bang for your buck. However, paid data provides various advantages above open-source options, often making it well worth the fees to access it.

Understanding how the two compare can help you make the right choice for your business.

What Is Open-Source Data?

Open-source data is data that anyone can access, modify and distribute. It can come from various sources, including government agencies, private companies and non-governmental organizations and nonprofits. 

Some well-known examples of open-source databases include: 

  • The U.S. Census
  • FiveThirtyEight
  • Pew Research Datasets
  • Yelp Open Dataset
  • International Monetary Fund
  • OpenStreetMap

Many open-source datasets are free to use, while some sources place theirs behind a paywall. However, all open datasets must be available in a format that users can easily access and modify — most often as downloadable documents distributed over the internet.

The Benefits of Open-Source Data

Weighing the pros and cons of open-source data against those of paid data providers will help you determine which is the better option for your organization. Here are the most significant advantages of using open-source data:

Accessibility

When it comes to open-source data pros and cons, the biggest pro is its accessibility. Open-source databases are readily accessible online, making them an easy source of information for anyone who needs it. 

Since most open-source datasets are free, your organization can save valuable time and money you would have spent collecting it yourself.

Greater Engagement

Many open-source data initiatives come from specific communities, which can help your organization identify opportunities for building better connections with those groups.

For example, if you’re considering expanding into a certain region, point of interest (POI) data collected from local communities can help you better understand the area and its unique characteristics.

Deeper Transparency

Because open-source data is so readily available, it creates a clear line of sight for everything related to the issue or topic it addresses. For community members, this visibility means greater accountability for policymakers and other leaders. From a business standpoint, it gives you a top-down view of your market, which can help you build more effective marketing and growth campaigns.

The Cons of Open-Source Data

With those pros in mind, it’s important not to overlook the issues that come with open-source data. Some of the biggest risks of open-source data include:

Data Quality Issues

Using inaccurate data to inform strategic decisions can cost your business hundreds or even thousands of dollars in lost profitability. Few international open-source providers have centralized control over their databases, which makes it more difficult to conduct regular quality checks of all datasets.

As a result, large databases tend to suffer from regional inconsistencies in data quality, such as:

  • Improper schema implementation
  • Missing data points
  • Invalid or incorrect values
  • Issues with precision
  • Duplicate data
  • Bias

Of course, there are plenty of open-source databases that publish reliable information — however, due to the lack of frequent reviews, it’s often a better idea to treat them as a jumping-off point for your research rather than your only source.

Data Manipulation

Because anyone can edit open-source datasets, users can skew the data for an ulterior motive, such as:

  • Gaining a competitive advantage: Businesses might alter the data to sabotage their competitors or to improve their own image. 
  • Influencing user behavior: People use open datasets like OpenStreetMap to find businesses nearby. Altering the data can steer users toward specific products and services and away from others.
  • Pushing a business or political agenda: Companies and political organizations may manipulate data to support their viewpoints or push their products and services.
  • Causing disruption: Malicious actors may manipulate open data to create confusion and disrupt operations. For example, inaccurate data can impact navigation for people using open mapping data to find businesses in their area.

Outdated Information

One of the biggest issues with open-source data is that open datasets are rarely current. The U.S. Census is a great example, as the database only updates once every 10 years.

Although some open-source projects might update more frequently, this task often falls to volunteers who may be inexperienced with large datasets and metadata. These individuals can accidentally introduce errors into the data that could seriously alter the results.

Pros of Third-Party Data Vendors

Although open-source data has many advantages, its limitations mean it’s not often the best choice for business decision-making. Here are some of the reasons a paid data provider like dataplor might be a better source for POI data:

Accuracy and Quality

A reliable data vendor leverages all its resources to ensure you’re using the most accurate, complete and up-to-date data possible. 

At dataplor, for example, our in-house team of international data scientists and analysts uses a combination of proprietary machine learning technology and local expertise to review and resolve data quality issues in near real time.

Cost Savings

While it may sound counterintuitive, investing in good data can help you save money in the long run. Using data from a reputable source can help you avoid the kinds of missteps that could cost your organization hundreds or even thousands of dollars. 

More importantly, though, quality data can guide you toward business decisions that:

  • Optimize operational efficiency
  • Inspire greater customer loyalty
  • Boost overall profitability
  • Unlock new revenue streams
  • Spark innovation

As a result, you save more over time, giving you a notable return on your investment.

Cons of Paid Data Providers

The main consideration is that you will need to pay some kind of fee to access and use the data. Some providers operate using a subscription model, where your monthly or annual fee gives you access to all available datasets. Others charge according to usage. 

However, it’s important to remember that you are paying for a quality product. Paid data providers have the resources to update and maintain their datasets frequently, so you always have accurate data at your disposal.

Trust dataplor for High-Quality Global POI Data

Free doesn’t always mean better. Although open-source data can be a useful tool when beginning research on a specific POI, investing in quality data from a reputable source is the way to go to make more informed decisions and minimize risk.

Subscribing to dataplor gives you access to location data you can trust. Schedule a consultation today to request a free data sample tailored to your company’s unique goals and requirements.