Blog
Esri 2026: The questions everyone was asking about global data

The Esri User Conference brought 20,000 attendees to San Diego, and our team spent three days on the floor talking to as many of them as we could. (If you stopped by, you already know we were handing out Dataplor passports. Did you get yours stamped?)
We came home with a long list of conversations worth sharing. Here’s what came up the most.
Market expansion is the driving use case
Ask a room full of GIS and location data professionals what they need most, and the answer keeps coming back to the same place: where should we open next? Site selection and market expansion were the single biggest topics of conversation at our booth, with retail and quick service restaurant attendees in particular asking how better location data can help them make better decisions.
Curiosity about global data is high, and so is the need for it
A recurring pattern emerged in booth conversations. Someone would ask whether accurate, usable location data actually exists outside the United States. We would answer with specifics: country-level examples, our span across 250 countries and territories, real numbers behind the 370 million-plus places in our dataset.
Several conversations also centered on cross-visitation analysis. Retailers wanted to understand how customers move between neighboring markets or competitive locations that sit close together but across borders. This is a specific, underserved need. Most location data providers are built around a single country’s footprint, which makes this kind of analysis difficult or impossible. It is a clear point of differentiation for platforms built with a global dataset from the start.
This tells us that the market has been trained to assume global location data is either unavailable or unreliable. We were able to prove quickly and specifically that the data holds up, and it can answer questions domestic-only tools cannot.
Customer journey and attribution are the next conversation
Once a prospect understood what our data could do for site selection, the conversation often expanded on its own. Attendees wanted to know whether the same data could inform marketing attribution and customer journey mapping, not just where to build, but how to reach people once they are there. It is a natural extension of the core use case, and it points to location intelligence platforms becoming a broader partner in a company’s growth strategy.
The gap in US-only tools kept coming up
This theme was impossible to miss. Prospects who already use a US-focused location analytics tool wanted to know whether we could fill in what that tool cannot: markets outside the country. One conversation captured this well: A technical contact at a major retail brand described relying on a domestic tool for site and market analysis, but explained that his team’s growing need for insight into international markets was going largely unmet. Once we described our span across more than 250 countries and territories, the conversation shifted quickly from whether the data exists to how his team could get access to it.
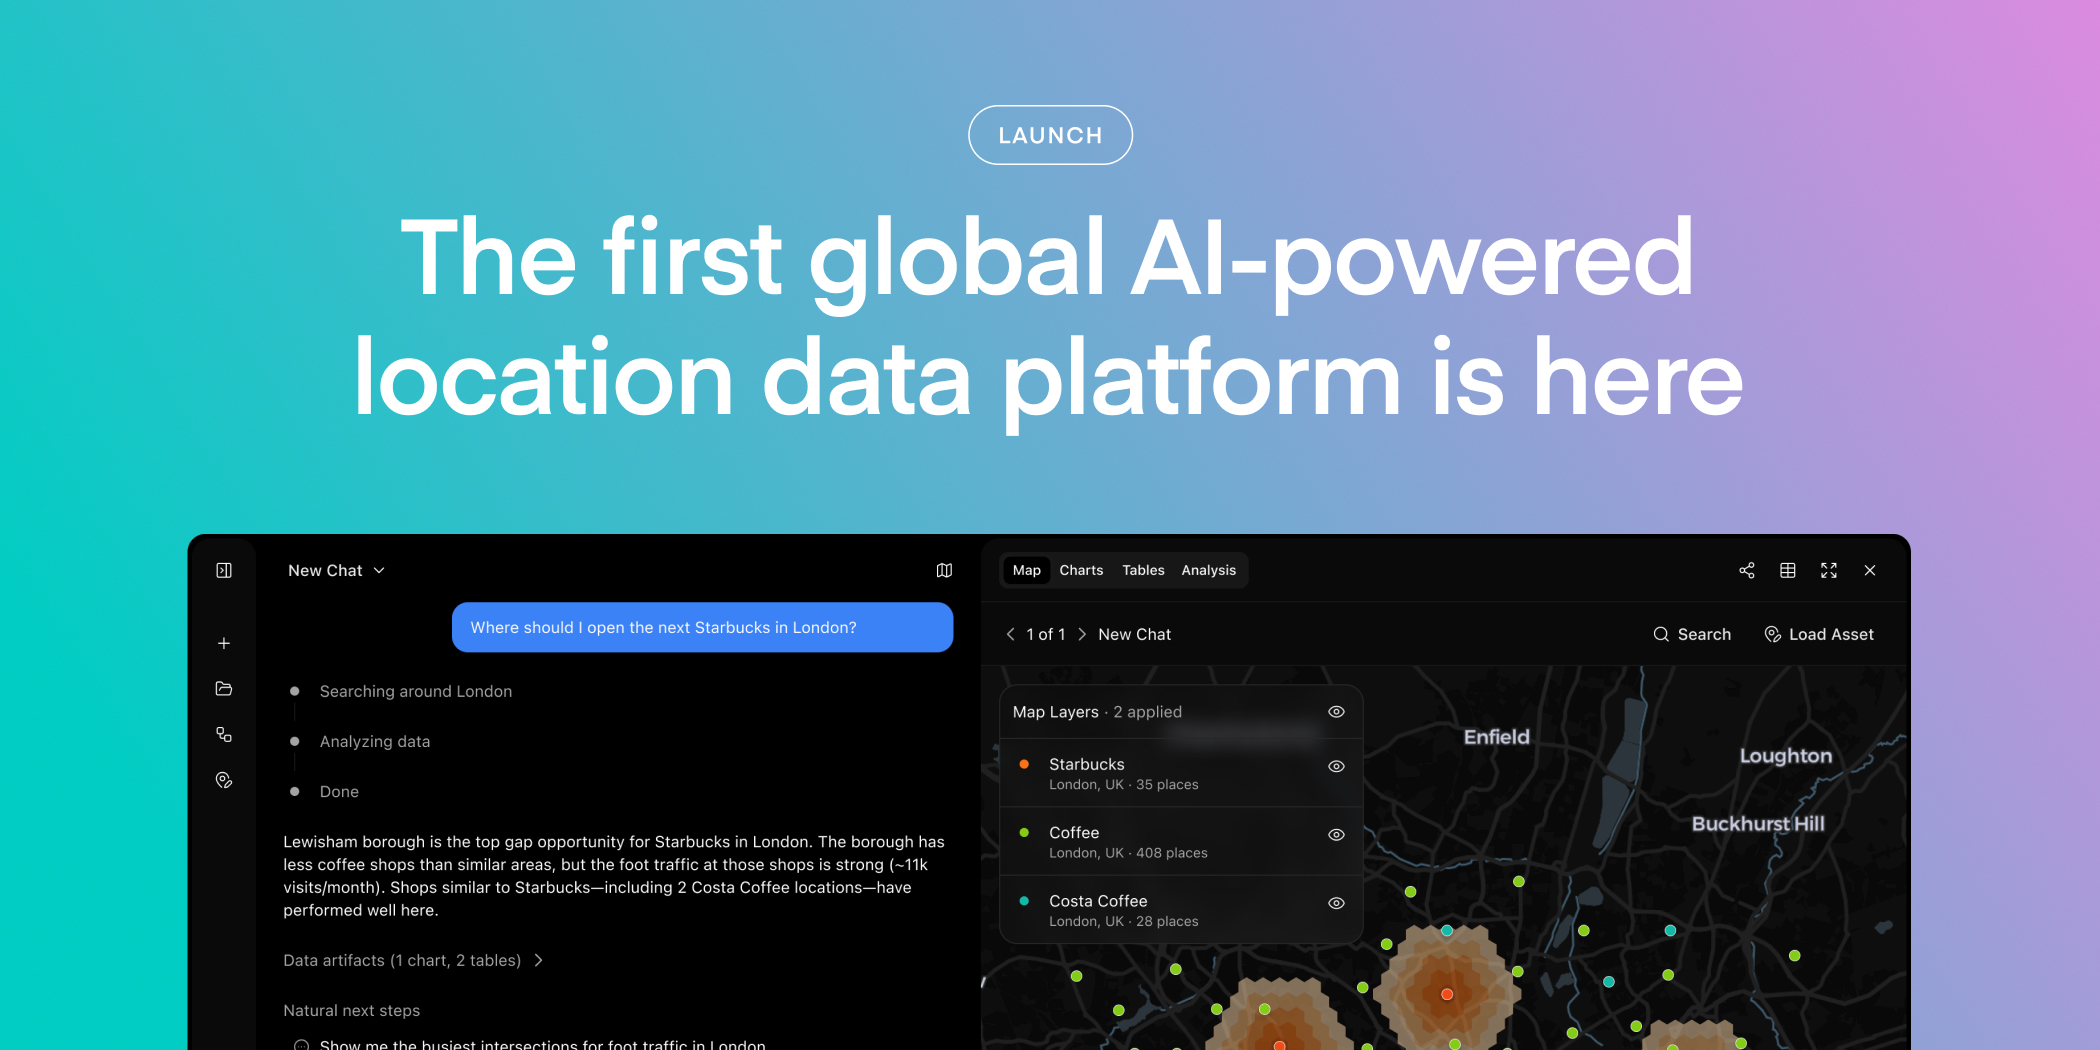
If any of this sounds familiar, you may want to try our Global Platform. Book a demo.


Get the full story
Subscribe for the latest on location intelligence, places data, and the trends behind better business decisions.
Subscribe