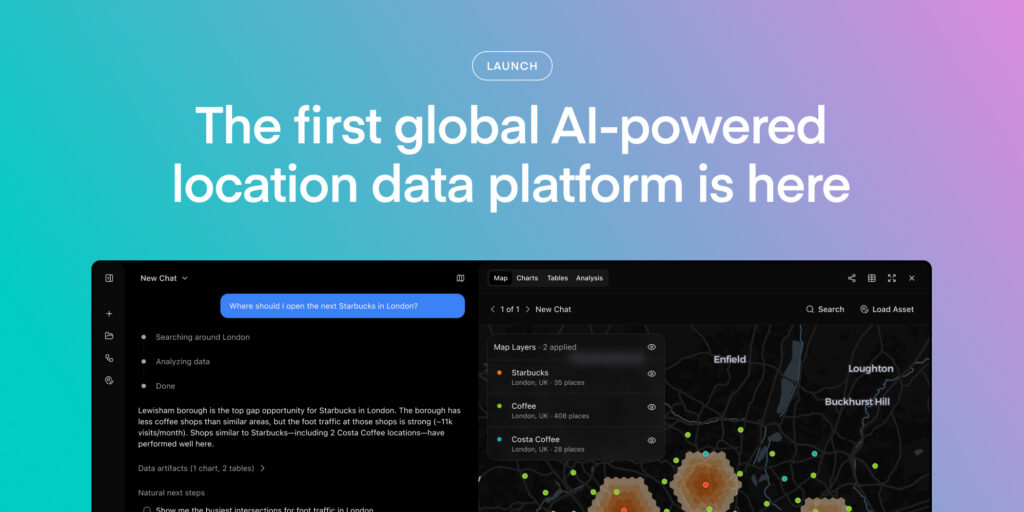
Esri 2026: The questions everyone was asking about global data

Blog

Esri 2026: The questions everyone was asking about global data

Christine Detris
 Jul 23, 2026  •  5 min read

The Esri User Conference brought 20,000 attendees to San Diego, and our team spent three days on the floor talking to as many of them as we could. (If you stopped by, you already know we were handing out Dataplor passports. Did you get yours stamped?)

We came home with a long list of conversations worth sharing. Here’s what came up the most. 

Market expansion is the driving use case

Ask a room full of GIS and location data professionals what they need most, and the answer keeps coming back to the same place: where should we open next? Site selection and market expansion were the single biggest topics of conversation at our booth, with retail and quick service restaurant attendees in particular asking how better location data can help them make better decisions.

Curiosity about global data is high, and so is the need for it

A recurring pattern emerged in booth conversations. Someone would ask whether accurate, usable location data actually exists outside the United States. We would answer with specifics: country-level examples, our span across 250 countries and territories, real numbers behind the 370 million-plus places in our dataset. 

Several conversations also centered on cross-visitation analysis. Retailers wanted to understand how customers move between neighboring markets or competitive locations that sit close together but across borders. This is a specific, underserved need. Most location data providers are built around a single country’s footprint, which makes this kind of analysis difficult or impossible. It is a clear point of differentiation for platforms built with a global dataset from the start.

This tells us that the market has been trained to assume global location data is either unavailable or unreliable. We were able to prove quickly and specifically that the data holds up, and it can answer questions domestic-only tools cannot.

Customer journey and attribution are the next conversation

Once a prospect understood what our data could do for site selection, the conversation often expanded on its own. Attendees wanted to know whether the same data could inform marketing attribution and customer journey mapping, not just where to build, but how to reach people once they are there. It is a natural extension of the core use case, and it points to location intelligence platforms becoming a broader partner in a company’s growth strategy.

The gap in US-only tools kept coming up

This theme was impossible to miss. Prospects who already use a US-focused location analytics tool wanted to know whether we could fill in what that tool cannot: markets outside the country. One conversation captured this well: A technical contact at a major retail brand described relying on a domestic tool for site and market analysis, but explained that his team’s growing need for insight into international markets was going largely unmet. Once we described our span across more than 250 countries and territories, the conversation shifted quickly from whether the data exists to how his team could get access to it.

If any of this sounds familiar, you may want to try our Global Platform. Book a demo.

Get the full story

Subscribe for the latest on location intelligence, places data, and the trends behind better business decisions.

Subscribe

We mapped every 2026 World Cup stadium. Here’s where the opportunity lies.

Blog

We mapped every 2026 World Cup stadium. Here’s where the opportunity lies.

Christine Detris
 Jul 16, 2026  •  5 min read

The 2026 World Cup is the first tournament to span 3 countries. Matches have taken place across 11 cities in the United States, 3 in Mexico, and 2 in Canada. That means 16 venues, each sitting in its own landscape of restaurants, bars, hotels, and shops.

Those landscapes are not the same. A stadium in the middle of a dense downtown looks nothing like one ringed by parking lots and highways. So we asked a simple question of our Global Platform: what is actually around each of the 16 venues right now? We counted the restaurants, bars, hotels, and retail within 2 miles of every stadium, across all 3 countries, using one consistent dataset. In total, we mapped 35,674 places.

Here’s what we found.

What’s around all 16

Here are all 16 venues, ranked by the total number of restaurants, bars, hotels, and retail locations within 2 miles.

The total tells the headline story, but the mix underneath it is where each venue shows its character. 

BMO Field in Toronto has 242 hotels within 2 miles, the most of any venue on the list, well ahead of second place. It sits mid-pack on the overall ranking, but for brands booking blocks of rooms for staff or guests, Toronto has more hotel supply nearby than anywhere else.

Estadio Azteca in Mexico City has 4,720 retail locations within 2 miles, more than the bottom 8 venues combined. For a retail or consumer brand, that’s a massive (and crowded) existing market. The customers are there, but so is the competition, and raw counts can’t tell you which wins. The next step is to analyze foot traffic and trade areas: they show whether those places actually draw crowds, and where the crowds come from.

Levi’s Stadium in Santa Clara stands out for what’s missing. It has plenty of restaurants and retail nearby, but only 10 bars within 2 miles. Of the 786 places around it, just 1 in 79 is a bar, the lowest share of any venue on the list. For a beverage brand, there’s white space: a stadium full of fans with almost nowhere nearby to imbibe. 

Packed blocks, empty lots

The top of the ranking is dense. The bottom is open.

Gillette Stadium in Foxborough and GEHA Field at Arrowhead in Kansas City sit at the bottom, with 169 and 170 total places within 2 miles. For scale, Estadio Azteca has roughly 47 times as many places within 2 miles as Gillette does.

But a low count doesn’t mean the same thing everywhere. Gillette sits next to Patriot Place, a walkable dining and retail complex, so its nearest restaurant is just 0.15 miles away. Arrowhead’s is nearly a mile away, across a large parking lot. Same restaurant count, but very different realities on the ground. 

One brand, almost everywhere

For all the contrast between venues, one name turns up almost everywhere, and it’s no surprise. McDonald’s appears 53 times on our list, and it reaches 14 of the 16 stadiums, more venues than any other chain. Chick-fil-A is next, with 21 locations across 7 venues.

Only 2 venues have no McDonald’s within 2 miles: MetLife Stadium, ringed by the highways and wetlands of the Meadowlands, and Estadio Akron in Zapopan. Akron is the surprise, dense enough overall that you would expect one.  Everywhere else has at least one, with up to 11 near BC Place in downtown Vancouver. Who knew Vancouverites had such an affinity for the golden arches? 

Three countries, one map

Look again at the top of the ranking. The 4 densest venues are Estadio Azteca, BC Place, Estadio BBVA, and BMO Field. All 4 sit outside the United States. The first American venue, Mercedes-Benz Stadium in Atlanta, doesn’t appear until rank 5.

Azteca leads the entire field by a wide margin, with roughly 40 percent more total places than the next venue.

Counting places around a stadium in Mexico City, then Vancouver, then Kansas City, and trusting the numbers mean the same thing, takes one dataset built to the same standard in every market. That’s where most data stops short: if the method changes at the border, the numbers can’t be compared. The Global Platform holds steady across all 3. For a brand deciding where to spend across the US, Mexico, and Canada, this is the one dataset that lets you compare them on equal footing.

The takeaway

Every venue sits in a different landscape. MetLife Stadium hosts the final, the match the whole tournament builds toward, yet it ranks 9th of 16 for what surrounds it. Roughly 8 times as many places sit within 2 miles of Estadio Azteca as of the stadium hosting the final. For a brand, a sparse area around a busy stadium is the opportunity: the fewer businesses already there, the easier it is to stand out. 

Some venues are surrounded by hundreds of places, others by a few dozen, and that gap holds across restaurants, bars, hotels, and retail. Knowing what sits around a venue, down to the individual business, is where the decision starts: where to open, where to stock, where to advertise. 

Want to see the places around a venue that matters to you? Explore our Global Platform.

Methodology Notes: Data current as of July 2026. Includes operationally active places only. Counts reflect all qualifying places within a 2-mile radius of each stadium, measured as a straight-line distance from the stadium’s center coordinates. For a more detailed methodology, contact us.

Get the full story

Subscribe for the latest on location intelligence, places data, and the trends behind better business decisions.

Subscribe

Bridging the Data Gap Between the Digital and Physical Worlds

Blog

Bridging the Data Gap Between the Digital and Physical Worlds

Kayla Kauffman
 Jul 01, 2026  •  4 min read

Digital engagement has never been easier to measure. Brands can track clicks, impressions, app opens, reviews, and social interactions in near real time. But as digital analytics have become more sophisticated, a critical blind spot has grown alongside them: understanding what actually happens in the physical world.

For many organizations, performance is still evaluated primarily through online behavior. Yet revenue, growth, and competitive advantage are ultimately driven by real-world activity: where customers go, which locations succeed, and how physical environments shape outcomes. Closing the gap between digital signals and physical reality is now one of the most important challenges facing data-driven teams.

Why the digital–physical divide is growing

Consumers increasingly move fluidly between online and offline experiences. They research products online, engage with brands on social platforms, read reviews, and build shopping carts—then make decisions that may or may not result in a store visit. Digital intent does not always translate into physical action.

At the same time, many organizations have overcorrected toward digital-only measurement. Online engagement is easier to capture, faster to analyze, and often treated as a proxy for success. But without real-world context, those signals can be misleading. A strong digital presence does not guarantee foot traffic, and online hype does not always indicate that a location, market, or expansion strategy is working on the ground.

What gets missed when teams focus only on digital metrics

When performance is evaluated through digital analytics alone, entire categories of customer behavior go unmeasured. Store visits, trade-area dynamics, competitive proximity, and physical constraints such as store size or co-location within a building are often excluded from analysis.

These blind spots matter. Two locations with similar online engagement can perform very differently in the real world based on their surrounding environment. A brand expanding into a new city may see strong digital interest, but without understanding local foot traffic patterns, nearby competitors, or neighborhood characteristics, that interest may never convert into sustainable performance.

This lack of offline context frequently leads to misinterpretation. Teams may assume a market is underperforming when the issue is location-specific. Others may overestimate opportunity based on online buzz without validating whether real-world conditions support growth.

How location intelligence connects digital signals to physical outcomes

Accurate point-of-interest and foot traffic data provide the missing link between online behavior and physical reality. By precisely identifying places in space and keeping those records continuously updated, location intelligence enables teams to see what is actually happening on the ground.

Fresh places data matters because the physical world changes constantly. Stores open and close, brands relocate, and categories shift within shared buildings. Layer foot traffic onto accurate places inside a defined trade area and you can see where demand concentrates, where competitors intercept it, and where white space remains. And leaning on an AI-driven platform can turn that work into a question you ask, with the answer back in seconds. 

When this physical foundation is in place, digital signals become far more valuable. Online engagement, reviews, check-ins, and operating hours can be analyzed alongside visitation trends, proximity to competitors, and surrounding place attributes. Together, these datasets create a more complete picture of demand, performance, and opportunity.

Benefits of unified data

Bridging digital and physical data unlocks better decision-making across industries.

Retailers and consumer brands gain clearer attribution by understanding whether digital campaigns actually drive store visits. Quick service restaurants can evaluate trade-area shifts, validate expansion strategies, and compare performance across markets using consistent real-world benchmarks. Investors and financial services teams can move beyond surface-level signals to assess brand health, expansion velocity, and competitive dynamics using observed physical activity.

Across all use cases, the outcome is the same: more confident forecasting, sharper competitive intelligence, and strategies grounded in how people behave in the real world, not just how they interact online.

Closing the digital–physical gap

Digital metrics will always be an important part of modern analytics, but they are only one side of the equation. Organizations that rely on digital signals alone risk making decisions in a vacuum, disconnected from real-world conditions.

The path forward is not choosing between online or offline data, but unifying them. Inaccurate or outdated POI records undermine analysis, from foot traffic modeling to competitive comparisons. That is why global coverage, frequent updates, and deep place attribution matter. 

Dataplor is built for this. We continuously collect, validate, and enrich global places and foot traffic data, so teams can pair real-world activity with their internal metrics and digital analytics. Rather than treating places as static points on a map, we show how locations function, change, and perform over time.

Our Global Platform brings that intelligence into one place. Explore any market on earth, define a trade area, and see the places, foot traffic, and competitive dynamics that shape performance, wherever you operate or plan to expand. 

Ready to see how it works? Contact us to get started. 

Get the full story

Subscribe for the latest on location intelligence, places data, and the trends behind better business decisions.

Subscribe

The Best Way to Work with AI? Our CTO’s Take on Spatial Stack

Blog

The Best Way to Work with AI? Our CTO’s Take on Spatial Stack

Christine Detris
 Jun 18, 2026  •  5 min read

Drop a brilliant new hire into a project on day one with no documentation, no data, and no idea how your team works, and they’ll struggle. Give them your knowledge base, your standards, and the tools to find what they need, and they’ll take off.

Ryan Urabe, Dataplor’s cofounder and CTO, posits that AI works exactly the same way.

He joined Matt Forrest on Spatial Stack to talk about what it actually takes to make AI useful for location data, including why the models matter less than the context around them, how embeddings are turning categories and brands into something you can map, and what changes when analysis that used to take months happens before your coffee’s cold.

1. The models are roughly the same. The harness is everything.

There’s been a lot of talk about whether geospatial needs its own purpose-built AI. Ryan’s take: not really—no more than law or medicine. The flagship models are converging in capability, and open-weight models are catching up fast. The real edge isn’t the model you pick. It’s the context, tooling, and best practices you build around it.

2. Treat AI like a capable employee on their first day.

The most useful mental model isn’t a magical box where you type in requirements and finished work pops out. It’s more like onboarding a sharp new hire. Hand them a data library, documentation, code standards, a style guide, and easy tool calls to look things up instead of guessing, and they start making real progress fast. The same things that make a person effective make AI effective.

3. Data quality isn’t a phase you finish. It’s the whole game.

Garbage in, garbage out hasn’t gone anywhere. AI is an accelerant on top of clean, trustworthy data, not a substitute for it. The way Ryan frames progress is worth stealing: you’re not measuring “are we 80% done?” You’re watching whether the questions you can ask are getting more sophisticated. When you’re asking the same basic questions over and over, that’s stasis. When the questions keep getting harder, that’s progress.

4. Embeddings empower to AI scale judgment that used to be manual 

An embedding turns text about a place into a list of numbers (coordinates) that capture what it means rather than how it’s spelled. Places with similar meanings land close together, even when the words look nothing alike.

“Supermarket” and “grocery store” share almost no letters but land right next to each other. A 7-Eleven in Tokyo and one in Tennessee get tagged in different languages, yet map to the same spot. And once categories and brands live in that space, the geospatial toolkit (distance, clustering, buffering) applies to them too. You can start at McDonald’s and “buffer out” to Wendy’s and Burger King without ever touching a coordinate.

This is just one example of a larger shift: judgment that didn’t scale, like deciding whether two store types are “the same,” is now something AI can do at the scale of the entire dataset. 

5. The payoff: analysis that used to be a dissertation, done in ten minutes.

When you combine trusted data with the right context, agentic AI starts to feel like a superpower. Insights that no single analyst could realistically piece together (and that used to take months) become something you can pull together over a coffee break. That’s the vision behind Dataplor’s agentic SaaS product. It was built to bias every answer back toward the map and put that capability in the hands of people who aren’t geospatial experts.

The bigger picture Ryan keeps coming back to: the industrial revolution ended the scarcity of labor, the digital revolution made information scalable, and AI is doing the same thing for intelligence. Nobody knows exactly where it lands, but the move right now is to stay humble enough to keep adapting, and curious enough to keep asking what you could do with it.

Dataplor’s Global Platform is launching this summer. Join the waitlist.

Listen to the full Spatial Stack episode

Get the full story

Subscribe for the latest on location intelligence, places data, and the trends behind better business decisions.

Subscribe

How to Use Trade Areas to Find White Space in a Crowded Market

Blog

How to Use Trade Areas to Find White Space in a Crowded Market

Christine Detris
 Jun 03, 2026  •  5 min read

A crowded market isn’t the same as a saturated one. Saturation means demand is fully met. Crowded means there are a lot of stores.

Brands often confuse the two, and it costs them. Competitive density makes a market look fully served when pockets of real demand are still going unmet.

Trade areas cut through that. Instead of asking where your competitors are, you start asking where customers are coming from and where they aren’t being captured. That’s a different question, and it requires a different perspective on the data to answer.

Why Competitor Maps Miss White Space

Most site selection analyses start with a competitor map. If an area already has several stores in the category, the assumption is that opportunity is limited.

But store count doesn’t tell you much on its own. A neighborhood with three competing locations might still have thousands of customers driving 20 minutes out of their way because none of those stores are actually close to where they live. That’s not a saturated market. That’s an underserved one.

A competitor map won’t show you that. It shows where stores are, not where customers are coming from or which areas aren’t being served. Trade areas fill that gap. Learn how Dataplor builds them.

How to Layer Trade Areas to Reveal White Space

When you map trade areas across a network of locations, two things become visible that weren’t before.

  1. Overlap. Trade areas that bleed into each other signal cannibalization risk. Before opening a new location, you want to know how much of its projected customer base is already being served by a store you own. That’s not a reason not to expand, but it’s a reason to expand differently, into geographies where the overlap is minimal and the unmet demand is real.
  2. Voids. Areas where demand signals exist but no trade area meaningfully covers them. A dense residential neighborhood where the nearest store in the category is a 25-minute drive is a void. These gaps are often where white space opportunities emerge, though they still need to be validated against factors like accessibility, visibility, and competitive dynamics. 

Layering in area-level mobility data sharpens all of this. It shows where your customers are coming from, as well as where people are moving, and whether your footprint is aligned with that movement.

The White Space Hiding Inside a “Crowded” Market: A Use Case

A specialty retailer expanding into Canada from the United States ran into a version of this problem. They had strong brand recognition in their core markets and a clear customer profile, a specific demographic and spending pattern that informed every real estate decision. But in Canada, they had none of the underlying data infrastructure they relied on at home.

The surface read was that the market was competitive. Major players already had a presence. Malls were spoken for. But trade area analysis told a different story.

The retailer’s customers didn’t shop everywhere. They concentrated around specific power centers, malls and neighborhoods. When the team mapped where their customer profile was spending time versus where existing stores were capturing them, meaningful gaps appeared. 

These locations would not have surfaced from a standard competitive mapping exercise. They surfaced because the team asked “where is our customer not being served.”

Trade area data also shaped decisions in markets where they already had a footprint. Before opening a new location, the team modeled how much of its projected customer base overlapped with existing stores nearby. That analysis shaped where to open, shifting the site just enough to draw from a different catchment (the geographic area a store pulls its customers from) and reduce overlap without sacrificing the right customer mix. 

Turning White Space into a Site Decision

Most brands look at a crowded market and move on. The ones gaining ground are asking a different question: where is demand going unmet? More often than not, the white space was there the whole time. They just needed trade areas to see it. 

Curious what white space opportunities exist in your markets? Request a demo.

Get the full story

Subscribe for the latest on location intelligence, places data, and the trends behind better business decisions.

Subscribe

Foot Traffic, Global Data, and the AI Moment: Our Top 6 Takeaways from ICSC 2025

Blog

Foot Traffic, Global Data, and the AI Moment: Our Top 6 Takeaways from ICSC 2025

Christine Detris
 May 28, 2026  •  5 min read

ICSC Las Vegas never disappoints when it comes to reading where commercial real estate is headed. This year, the conversations across the show floor kept circling back to the same frustrations: data that stops at the US border, foot traffic tools that can’t tell you how a tenant is actually performing, and a growing sense that existing data is either incomplete or just plain messy.

We talked with brokers, REITs, retailers, restaurant operators, and even municipalities over the course of the show. Here’s what stood out.

1. Global coverage is the number one gap

Across booth conversations and sessions, the most consistent feedback was simple: most data providers only cover the US, but portfolios don’t. We heard this from international retailers, global REITs, and brokers with exposure to markets in Europe and Latin America. When your existing foot traffic platform can’t tell you what’s happening in Spain, Portugal, or Chile, you’re making international location decisions in the dark.

2. Over-expansion pain is making operators much more cautious about new sites

We heard multiple versions of the same story: a brand expanded too quickly, opened a store that cannibalized an existing location, and had to close it. That experience is now driving a much more deliberate approach to site selection. Restaurant operators and specialty retailers alike are asking harder questions about competitor density and trade area overlap before they sign a lease, and they want data that can actually answer them.

3. The incumbent data providers are showing their limits

Brokers and asset managers told us they are only moderately satisfied with what they have and are always looking for what’s next, especially around retail rankings, deeper benchmarks, and global coverage. The thread connecting all of it: existing platforms are either US-only, incomplete, or difficult to use for anything beyond surface-level foot traffic. Teams are cobbling together multiple sources and ending up with inconsistent data and a messy story to tell.

4. CRE teams are building internal data infrastructure and need a clean foundation

Several REITs and brokerage firms told us they are actively building internal analytics capability and looking for a reliable points of interest (POI) layer to build on. The ask was specific: property diagnostics, tenant mix benchmarks, competitor leakage scoring, and retail rankings. They want a data partner that can serve as both the foundation and the analytics layer, not just another dashboard to log into.

5. Municipalities are using location data to compete for anchor tenants

One of the more unexpected themes was economic development teams showing up with real data questions. Several municipalities asked specifically about using points of interest data to understand where consumers in their trade area are spending money elsewhere, and how to use that to build a case for attracting anchor retailers. 

6. The market is ready for AI-driven location intelligence

Interest in AI-powered tools came up consistently across conversations. Teams want platforms that can surface answers quickly without requiring a data science team to run every analysis. It’s something we’ve been heads down on and based on what we heard at ICSC, the timing is right. Our global platform will soon allow you to ask questions about any place in the world in plain language, pull one-click trends and competitor benchmarks, and export the underlying data directly into your own systems. 

Ready to see our platform in action? Contact us for a demo. 

Get the full story

Subscribe for the latest on location intelligence, places data, and the trends behind better business decisions.

Subscribe

Why Trade Areas Matter (And How We Build Them)

Blog

Why Trade Areas Matter (And How We Build Them)

Christine Detris
 Apr 30, 2026  •  5 min read

Every business that depends on physical location eventually asks the same question: who are my customers, and where do they come from? It sounds simple, but answering it accurately has historically required either expensive surveys or a lot of guesswork. Trade areas are how the industry has tried to solve that problem, and the methodology behind them has changed dramatically in recent years.

What Is a Trade Area?

A trade area is an estimate of where the visitors to a specific place live. Not a rough circle drawn around a pin on a map, but a probability surface derived from observed device behavior, built from the real movement patterns of real people.

The industry used to rely on the radius approach, which draws a circle of a fixed distance around a location and assumes everyone within it is a potential customer. The problem is that physical distance is a poor proxy for how people actually move. A two-mile radius in dense urban Chicago captures hundreds of thousands of people and dozens of competing options. The same radius in rural Wyoming captures almost no one. Drive-time estimates improve on this somewhat, but they still don’t account for the fact that people routinely cross busy highways to reach one store while ignoring a closer competitor, or that customers at a downtown coffee shop may commute in from twenty miles away every morning.

A genuine trade area reflects what people do rather than what we assume they do. 

What Are Trade Areas Used For?

Across various industries, knowing where customers come from changes the quality of every question you can ask.

Site Selection: Opening a new location is one of the most capital-intensive decisions a business can make, and trade areas make it a sharper one. By mapping where current visitors live, you can assess whether a prospective site would draw from a genuinely new customer base or pull visitors away from an existing location. Two stores five miles apart might seem complementary until their trade areas reveal 70% overlap. Trade areas also help you find the gaps: areas with dense populations and long travel distances to any comparable option are exactly where expansion makes sense.

Competitive Intelligence: Trade areas let you see not just who your customers are, but who your competitors are drawing in. If a rival location is attracting customers heavily from a neighborhood that requires crossing a major highway to reach it, there may be an opportunity to serve those customers closer to home. If a competitor’s reach extends significantly farther than expected, that’s a signal about brand strength worth taking seriously. Understanding the geography of your competitive landscape is much harder without trade area data, and much easier with it.

Tenant Analysis: For landlords, investors, and developers, trade areas answer the question of true catchment. A prospective tenant’s claim about how far customers will travel is not the same as what the mobility data actually shows. Trade areas provide an objective basis for evaluating tenant quality and anchor value, and for understanding whether a retail property is drawing from the population density it needs to justify its lease terms.

Media Targeting: Knowing where your customers live tells you where to reach them before they ever leave for the store. Trade areas provide the geographic foundation for pre-visit advertising, enabling brands to concentrate spend in the neighborhoods that actually convert rather than broadcasting across an entire metro area. The result is more efficient campaigns and stronger attribution between ad exposure and in-store visits.

How We Build Trade Areas at Scale

Our trade area methodology pairs global population trends and makeup with 31.1 trillion location pings. (To visualize this number, imagine every ping is a penny. If you stack them, the pile would reach almost to Mars.) We received nearly 141 billion new pings in a single day last month, and that volume is accelerating.

The process of turning those pings into trade areas runs through six stages:

  1. Ingesting and filtering raw pings to remove noise and non-human signals
  2. Grouping the cleaned pings into visits against our global database of points of interest
  3. Building a device catalog that estimates where each person lives based on 24 months of location history
  4. Classifying those home locations using signals like time of day, day of week, and commercial versus residential density
  5. Generating the trade area surface that maps the geographic distribution of where visitors come from
  6. Recasting that surface into privacy-safe geometries appropriate for external use

The final output can be delivered in whatever geographic format a client needs, including US or Canadian census block groups, or EU local administrative units.

Start Using Trade Areas to Find Your Next Best Location

Where your customers come from is one of the most practically useful things you can know about a location. With meaningful accuracy, trade areas finally makes that answerable. And because the data is built on privacy-safe geometries that aggregate to census block group scale, you get the precision you need without compromising individual privacy. Talk to us today.

Get the full story

Subscribe for the latest on location intelligence, places data, and the trends behind better business decisions.

Subscribe

We Joined Matt Forrest to Talk Location Intelligence. Turns Out, Your Data is Broken.

Blog

We Joined Matt Forrest to Talk Location Intelligence. Turns Out, Your Data is Broken.

Christine Detris
 Apr 27, 2026  •  5 min read

Most companies don’t have a location data problem. The data and the signals exist. The real challenge is turning millions of rows of POI and foot traffic data into something a business can actually act on. 

Enter Emily Lisle, Head of Product at Dataplor. In her role, she builds solutions that deliver global location data to clients, helping them cut through market complexity and make more confident, growth-driving decisions. Emily got her start in the industry helping a festival app better understand fan behavior through movement data. That experience eventually led her to Dataplor, where she was encouraged to “try out new methods, explore new opportunities, and actually take the time to build something new.”

Emily joined Matt Forrest on Spatial Stack to discuss global POI data, the broken workflow between raw location data and real business decisions, and how AI is starting to change the equation. Here’s what stood out.

How Dataplor Turns Raw Data into Real Answers

One of the most honest moments in the conversation was when Emily described what Dataplor often hears from prospects: “We really want to use your data, but we don’t have the capacity or the technical skill on our team to do that.” 

To fill that gap, the Dataplor team launched a SaaS platform with the goal of helping people understand what questions they should be asking. That meant:

  • Pre-built analyses (like same-store year-over-year foot traffic) that answer well-defined questions without requiring raw data access
  • Flexible filters so users can define specific groups of POIs based on any attribute or segmentation. (Not just “Starbucks vs. Caribou Coffee,” but “Starbucks locations that opened before a certain date in a specific metro, compared to all other coffee shops that opened in that same window”)
  • Easy CSV export for users who want to do their own downstream analysis in Excel

The result is a platform that serves two kinds of users at once: the non-technical strategist who wants to go straight to an insight, and the data-savvy analyst who wants to pull clean, filtered data quickly.

Why Global Data Is Non-Negotiable for International Companies

Emily made it clear: if you’re analyzing Starbucks and you only have US data, you have about 50% of the picture. For any Fortune 1000 company with international operations, domestic-only foot traffic data is incomplete and actively misleading for competitive or financial analysis.

But operating at global scale introduces challenges: consistent schemas across wildly different markets, meaningful quality benchmarks for regions as different as Egypt and Connecticut, and mobility data that behaves very differently depending on the country’s privacy landscape. 

Dataplor’s POI data started with strong coverage in Latin America (with actual boots on the ground to collect data) and has since expanded to a genuinely global footprint, covering more than 250 countries and territories. When it came time to layer in foot traffic data, going global wasn’t optional. 

A Real Use Case: Finding the Right Distribution Partner in Mexico

One of the more concrete examples Emily shared involved a Consumer Packaged Goods (CPG) company using the platform for a market expansion analysis.

The company was evaluating which retail partners to prioritize in a new market in Mexico. The intuitive assumption was that more locations equals more reach, exposure, and more opportunities to move product.

The data told a different story. When they compared foot traffic across several brands—including Costco and some more regional players—they found that Costco, despite having far fewer locations, delivered higher total audience exposure than the regional brands combined. They had fewer doors, but each door received much more traffic.

That’s the kind of insight that changes an actual business decision. And it came from a market analyst using the SaaS platform directly, not from a data science team running a custom model.

Where AI Fits In (And What It Can’t Fix) 

The conversation ended with a look at where things are heading. Emily was clear that AI’s biggest role is helping users understand which graph they should be looking at and what it means for their business. That layer of personalization, she noted, is something you just can’t get to with standard reports and maps.

Dataplor is actively building toward an AI layer in the platform that can generate reports and synthesize answers to open-ended questions, but the ground truth layer has to underpin all of it. As Emily put it, you can’t just run an AI system over your entire dataset and assume it’s working. Dataplor maintains an international team of validators doing heavy manual review precisely because that foundation of trust becomes more important, not less, as AI gets more involved.

Listen to the full episode here. If you’re ready to see what global location data can do for your business, let’s talk.

Get the full story

Subscribe for the latest on location intelligence, places data, and the trends behind better business decisions.

Subscribe

What the Retail Industry Is Really Talking About: 4 Takeaways from Shoptalk Spring

Blog

What the Retail Industry Is Really Talking About: 4 Takeaways from Shoptalk Spring

Christine Detris
 Apr 10, 2026  •  5 min read

Every year, Shoptalk brings together thousands of retail leaders, emerging brands, and technology innovators to talk about where the industry is heading. This year’s conference was squarely focused on AI; how it can expand what their teams are capable of, how it can solve long-standing challenges in merchandising, demand planning, and customer engagement, and how to move past the hype and into real impact. 

Our team made the trip to Las Vegas to meet with players across the retail landscape firsthand, and while AI was impossible to ignore, some of our most energizing conversations kept coming back to the same question: what’s actually happening in the real world

Here’s what stood out.

1. CPG Distribution and Demand Visibility Is the Conversation

If there was one theme that ran through nearly every meaningful conversation we had, it was that brands are dealing with shifting demand across channels and formats, and most don’t have a clear view of how that plays out in physical retail. In fact, many conversations kept coming back to a surprisingly common concern: brands not knowing whether they’re in the right places, reaching the right customers, or growing in the right direction.These are exactly the kinds of long-standing retail challenges that Dataplor is solving with better data and smarter tools

2. Brands Know Where They Sell, But Not If Those Are the Right Stores

This was the most common “aha moment” we saw on the floor. Brand after brand had solid sales data, but when it came to whether they were optimally distributed or how to make a compelling case to a retailer for expansion, the answer was essentially a gut feeling. One version of this came up repeatedly: “We know where we sell, but we don’t know if those are the right stores, or how to convince retailers to put our product in more locations.” That’s exactly the gap location intelligence fills. Instead of relying on static store lists or retailer conversations alone, teams can look at real-world foot traffic patterns and retail density to prioritize where to go next, and make a data-backed case when they get there.

3. Brick and Mortar Is Having a Quiet Resurgence

For a conference where AI was the headline act, physical retail held its own in a surprising way. In our one-on-ones, a renewed focus on brick and mortar repeatedly surfaced. Many of the brand-side buyers we spoke with were almost relieved to shift the conversation to physical retail strategy. It’s not that AI and digital don’t matter, but the physical world hasn’t gone anywhere, and teams are starting to feel the gap between their digital sophistication and their visibility into what’s actually happening in stores. That energy was hard to miss. Which brings us to our final point…

4. The Physical World Is the Missing Layer in the AI Conversation

A significant portion of the attendees we met represented the digital and e-commerce sides of their businesses. This points to something important: the brands that are winning aren’t thinking about online and offline as separate problems. AI is reshaping how retailers think about decisions, and those decisions require robust, quality, and comprehensive data. The brands we spoke with are increasingly looking for ways to ground their strategies in real-world behavior, not just digital signals. Understanding the physical landscape—where demand is moving, where products should live, where to expand next—is a critical input to any well-rounded retail strategy. Talk to us to learn more.

Get the full story

Subscribe for the latest on location intelligence, places data, and the trends behind better business decisions.

Subscribe

An Intro to Movement Data: What it is and Why it Matters

Blog

An Intro to Movement Data: What it is and Why it Matters

Christine Detris
 Apr 08, 2026  •  5 min read

Movement data is data about how people move through the physical world. It’s derived from anonymized location signals off mobile devices, and it’s used across retail, commercial real estate, finance, and a growing list of other industries.

If you’ve ever seen a report that says a store received 15,000 visits last month, or that a shopping center’s traffic is up 8% year over year, that came from movement data.

Foot Traffic, Trade Area, and Other Common Terms

A lot of terminology in this space gets used interchangeably. Here are the ones worth knowing.

Foot Traffic: This is the most common term. It refers to how many people visit a physical location such as a store, restaurant, mall, or city block. Retailers have used this phrase for decades. In Europe you’ll often hear footfall instead.

Mobility Data: A broader, more encompassing  term. Foot traffic tells us how many people showed up at a specific place, while mobility data also covers where they came from, what else they visited, and how travel patterns shift over time. Think of foot traffic as one slice of the bigger mobility data picture.

Trade Area: This is the geographic region a location draws its visitors from. The old way was to draw a radius on a map. Now, movement data lets you build trade areas based on where visitors actually live and work, which often looks very different.

Dwell Time: How long someone stays during a single visit. Dwell time is useful for understanding the nature of visits and benchmarking across competitors.

Visits vs. Visitors: People tend to mix these terms up. Visits = total trips, including repeats. Visitors = unique people. Someone who goes to the same coffee shop every weekday generates five visits but counts as one visitor. Most datasets report visits.

How Does Movement Data Actually Work?

The short version:

  • Anonymized location signals are collected from mobile devices at scale
  • Signals are cleaned, normalized, and matched against databases of real-world places (points of interest, or POIs)
  • When a device’s signal falls within a known location’s footprint, that’s recorded as a visit
  • Since no provider can see every device, statistical models scale the sample up to represent the broader population. While most models use a simple ratio based on the number of devices seen in the area, Dataplor uses additional factors like online popularity and modeling off the POI brand and category to arrive at a more accurate estimate of foot traffic.

What Can Brands Do With This Information?

Site Selection: Evaluate potential locations based on traffic and visitor profiles

Competitive Benchmarking: Compare your traffic against competitors

Portfolio Monitoring: Track trends across your own locations

Investment Research: Use foot traffic as a leading indicator of company performance

Urban Planning: Understand commuting patterns and pedestrian flows

Product Distribution: CPG companies can discover which stores to prioritize

Common Questions About Movement Data

Is this data tracking individuals?

No. The location signals come from devices where users have opted into location sharing. The data is anonymized and aggregated, so no names and no personal identifiers ever enter the Dataplor ecosystem. The goal is to understand patterns at a location level, not to track specific people.

Does this work outside the US?

It depends on the data provider. Many started offering US-only data and have limited international coverage. Device panels and POI quality vary significantly by region. If you operate globally, don’t just ask whether your provider has data in a country, ask how deep it is and how accurate the foundational POI data is.

Who uses this?

Retail and restaurant brands, commercial real estate firms, financial services (from hedge funds to insurance carriers, and everything in between), marketing agencies, CPG companies, tourism and economic development organizations, and increasingly tech companies that use POI and traffic data as a foundational layer in their own products.

What should I look for in a provider?

  • Geographic Coverage: Does it cover the regions and categories you care about, and how deep does it go?
  • POI Quality: Visit data is only as good as the map of places it’s matched against.
  • Methodology: How is the modeling done, and how reflective of the real world is it?
  • Update Cadence: How often is the data refreshed, and does that match your workflow?

Getting Started

Regardless of what you call it, the goal remains the same: turn human movement into action for your business to both accelerate growth and mitigate downside risk. Talk to us to learn more.

Get the full story

Subscribe for the latest on location intelligence, places data, and the trends behind better business decisions.

Subscribe