Blog
Global Foot Traffic Trends: What the World’s Most Visited Places Reveal About Tourism’s Return

After years of closed borders and empty landmarks, the world is moving again. From the base of the Great Pyramid to the halls of the Louvre, tourism foot traffic is not only back, it’s shifting in ways that tell us more than just where travelers are going. It reveals how global tourism is evolving.
At dataplor, we use numbers to surface patterns, uncover behaviors, and guide more intelligent decision-making. That’s why we’ve built a foot traffic product rooted in trillions of movement data points. With this latest global tourism dataset, we’ve uncovered meaningful patterns, anomalies, and shifts that define the return of tourism from 2021 through 2024, and point to what 2025 will bring.
The Data That Tells the Story
In 2021, as travel bans slowly lifted, tourism began to crawl back. Places like the Louvre saw modest foot traffic (roughly 2.8 million visitors that year), while open-air icons like the Sydney Opera House and Tokyo Disneyland hovered around 6 million.
By 2022, the Colosseum in Rome saw foot traffic soar from over 1.5 million in 2021 to over 9 million, a year-over-year (YoY) growth of over 400%. The Taj Mahal, Christ the Redeemer, and Petra, all constrained by access and local policy, showed mild YoY growth of less than 50%. But the full comeback didn’t arrive until 2023, when global travel surged past many pre-pandemic benchmarks. Tokyo Disney saw an estimated 13+ million visits based on aggregated mobility patterns. The Sydney Opera House hosted over 10 million. The Great Pyramid at Giza crossed 7 million, reclaiming its place among the most-visited heritage sites in the world.
Beyond the Peaks: What the Footprints Reveal
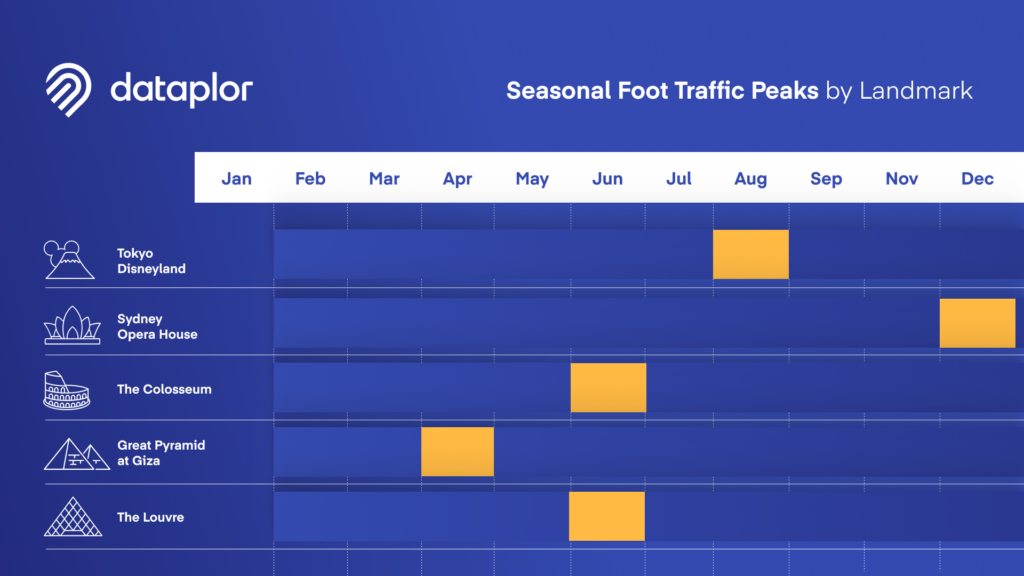
In 2024, travel demand has accelerated into the spring months. Compared to 2023, global foot traffic at top tourist sites rose by more than 11% in March alone, reflecting a growing preference for earlier trips, driven by favorable pricing and a desire to avoid peak summer crowds.
Meanwhile, the traditional summer hotspots remain dominant. The Colosseum continues to see over 1 million visitors in July and August alone. But even here, we see emerging constraints: extreme heat, labor strikes, and local policy interventions are reshaping not just when people travel, but how destinations manage that demand.
In Rome, for example, the introduction of the “Moon over the Colosseum” night tours in 2023 successfully redirected some tourist traffic to evening hours, helping to spread out demand and slightly boost October’s overall visitation. In Peru, a 23-day rail protest in early 2023 reduced Machu Picchu’s annual traffic by nearly 150,000, a reminder of how even short-term disruptions can erase months of tourism volume.
A New Tourism Calendar
Tourism is increasingly shaped by micro-events, some celebratory, some disruptive. And dataplor’s data captures these trends, offering timely visibility into shifting travel patterns.
- The Sydney Opera House marked its 50th anniversary with a yearlong celebration that began in October 2022 and concluded in October 2023, drawing a rare peak in visitor numbers during Australia’s typically quieter months.
- Strikes in Paris reduced March 2023 traffic at the Louvre.
- Across all sites in our dataset, October and December 2024 each saw more than 5.4 million visits, surpassing June. The trend points to extended holiday travel and growing interest in off-peak experiences driven by cooler weather, cultural events, and pricing advantages.
Whether driven by weather, politics, or pop culture, these moments ripple outward, impacting bookings, campaigns, and even regional economies.
What 2025 Might Look Like
Using four years of consistent seasonal benchmarks and trends, dataplor projects a continued shift toward earlier travel planning and spring surges.
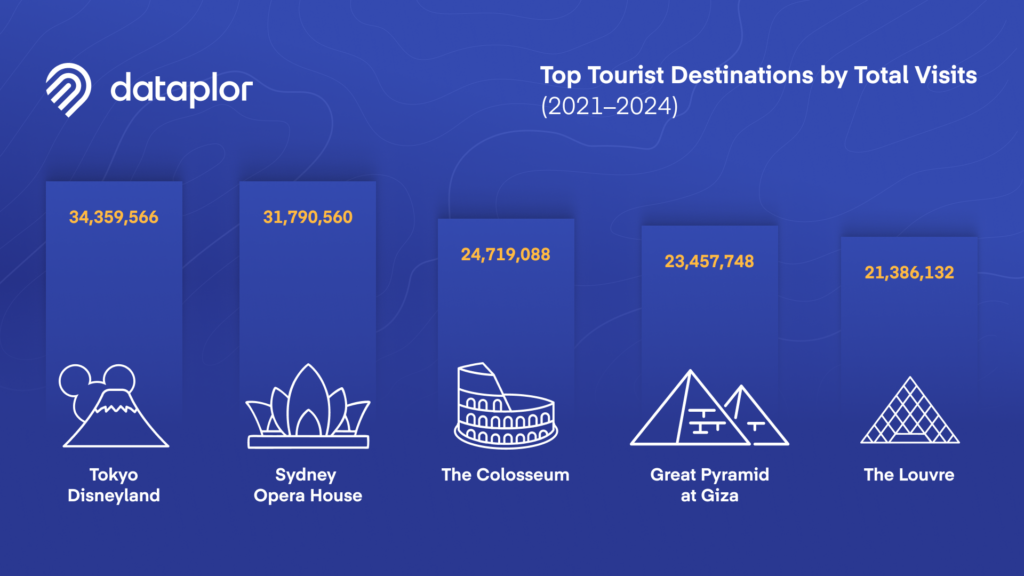
Based on recent trends, 2025’s most visited sites are expected to mirror past performance, with the top five being:
- Tokyo Disneyland
- Sydney Opera House
- The Colosseum
- Great Pyramid at Giza
- The Louvre
These landmarks show durable interest, seasonal consistency, and the ability to absorb disruptions. Meanwhile, sites like Petra and Machu Picchu, though smaller in raw volume, continue to show strong seasonality tied to weather and limited access, with peak demand condensing around narrow windows.
Another variable shaping 2025 tourism trends may come from beyond the travel industry itself. Trade tensions, shifting visa policies, and regional tariffs, especially involving China, the U.S., and the EU, could reshape cross-border travel flows. We’ve already seen how government actions directly affect tourism patterns: in Peru, anti-government protests in early 2023 led to the closure of Machu Picchu for nearly a month, resulting in a measurable drop in foot traffic. In France, nationwide strikes over pension reform triggered a temporary decline in March visitation to the Louvre. While dataplor doesn’t predict policy, our foot traffic data shows how quickly decisions at the top, whether diplomatic or domestic, can ripple through global movement. As 2025 approaches, we’ll be watching how geopolitics continue to shape where the world travels.
Why This Matters
Tourism isn’t just a consumer preference; it’s an infrastructure challenge, an economic driver, and a cultural signal. Cities, brands, and agencies all depend on accurate, timely data to make high-stakes decisions about pricing, staffing, events, and policy.
dataplor’s foot traffic product delivers:
- Verified POI-level insights across continents
- Month-over-month comparisons for multi-year analysis
- Granular visibility into seasonal and disruption-based shifts
From managing overflow crowds in Rome to launching early spring promotions in Peru, our data equips decision-makers with the tools to adapt in real time, and stay ahead of what’s next.
dataplor’s mobility insights illuminate that story, helping you respond to today and plan for tomorrow. Want to learn more about how our global foot traffic product can inform your business strategy? Reach out for a mobility sample.


Get the full story
Subscribe for the latest on location intelligence, places data, and the trends behind better business decisions.