Mar 19, 2026 / 4 min
The Localization Challenge: Why Global Brands Need Market-by-Market Data to Compete
Competing globally has never been simple, but the complexity brands are facing today is fundamentally different than it was even a few years ago. Consumers are more informed, more selective, and more vocal about where and how they spend their money. Brand loyalty can shift quickly as local preferences, economic conditions, and cultural norms evolve.
At the same time, organizations have more data available than ever before. The challenge is no longer access, but confidence. With a growing number of data providers in the market, decision-makers are often left navigating inconsistent coverage, varying quality, and limited local context. Without trustworthy, market-specific intelligence, even well-funded global strategies can miss the mark.
Why High-Level Data Is No Longer Enough
Strategic decisions are only as strong as the data behind them. Country-level or high-level datasets may offer a broad snapshot, but they often mask critical differences that exist within markets. High-growth neighborhoods and areas of attrition can emerge quickly, driven by shifting demographics, changing consumer behavior, or new competitive dynamics.
Hyperlocal preferences vary dramatically from one city block to the next. Without timely, granular data, brands risk acting on outdated assumptions or incomplete pictures of market demand. To compete effectively, organizations need a continuously updated view of local insights that reflect real-world change as it happens.
The Global vs. Local Disconnect
Many global strategies fail when they are not adapted to local realities. QSR brands may expand too aggressively before demand is proven, or fail to localize menus to reflect cultural tastes. Retailers can underestimate whether a specific neighborhood will embrace their brand, impacting inventory health. CPG companies may misplace premium or value-oriented products, leading to cannibalization or lost shelf space.
Similar challenges extend to commercial real estate, logistics, and technology platforms. Reusing a successful site selection model from one market in another often overlooks differences in co-tenancy, foot traffic behavior, or surrounding amenities. Inconsistent or incomplete POI data compounds these risks, creating blind spots that slow response to emerging trends or hide warning signs of market decline.
Why Market-Level & Micro-Market Data Matter
Granular, location-level data enables decisions that simply aren’t possible with aggregated views alone. Product placement, merchandising strategies, and consumer alignment depend on understanding who is shopping, where they are moving, and what they prefer locally.
Local context also reshapes how performance benchmarks and competitor analysis should be interpreted. A competitor’s portfolio may look strong at a national level while masking underperforming locations or oversaturated trade areas. Market-specific intelligence allows teams to assess cannibalization risk, identify consolidation opportunities, and allocate resources where they will drive the greatest return.
Across industries, the pain points differ, but the root issue is the same. Without high-integrity local data, CPG brands waste distribution spend, retailers and QSRs struggle with underperforming locations, technology platforms build models on incomplete inputs, and CRE teams take on unnecessary risk in multi-tenant decisions. But having the right data is only part of the equation. Knowing when to act on it is what separates leaders from the competition.
Why Now? Global Scale & Local Depth Create Competitive Advantage
The pace of market change has accelerated. Consumer preferences shift faster, new competitors emerge with less warning, and economic conditions vary more sharply across regions than they did even a few years ago. Brands that rely on annual data refreshes or static market studies are already behind.
The organizations gaining ground today are those investing in real-time, hyperlocal intelligence before their competitors do. In emerging markets and neighborhoods, timing is everything. The brands that act on early signals capture the opportunity; those that wait inherit the competition.
But speed alone is not enough. The strongest insights emerge when global coverage is paired with hyperlocal precision. Large datasets can obscure important outliers, while purely local views can exaggerate short-term noise. The ability to shift seamlessly between macro and micro perspectives enables teams to separate meaningful trends from anomalies. Consistent, comparable international datasets unlock advanced use cases such as predictive modeling, trend forecasting, and risk-adjusted investment analysis. They enable global teams to operate from a shared foundation of truth, ensuring strategies scale without losing relevance at the local level.
When organizations rely on validated, market-specific data, business outcomes improve across the board. Expansion becomes more targeted, marketing more efficient, and competitive positioning more defensible.
Real-World Scenarios: Where Localization Changes the Outcome
Consider a QSR brand planning to expand into Saudi Arabia. On the surface, demand appeared strong based on external signals. Localized category analysis, however, revealed stagnation in the burger segment and rising demand for healthier fast-casual options. With that insight, the brand shifted its entry strategy, reducing risk and improving its odds of success.
In another case, a spirits brand evaluating expansion into South Africa saw promising population growth at a national level. Hyperlocal intelligence told a different story. Growth in wine bars, breweries, and alternative alcohol categories signaled a shift in consumer preference. Without that localized view, the brand would have entered the market misaligned with demand.
Localized intelligence also reveals competitive saturation and whitespace. It can highlight underperforming competitor locations that should be avoided, or emerging neighborhoods where demand is growing and first-mover advantage still exists.
Closing the Localization Gap
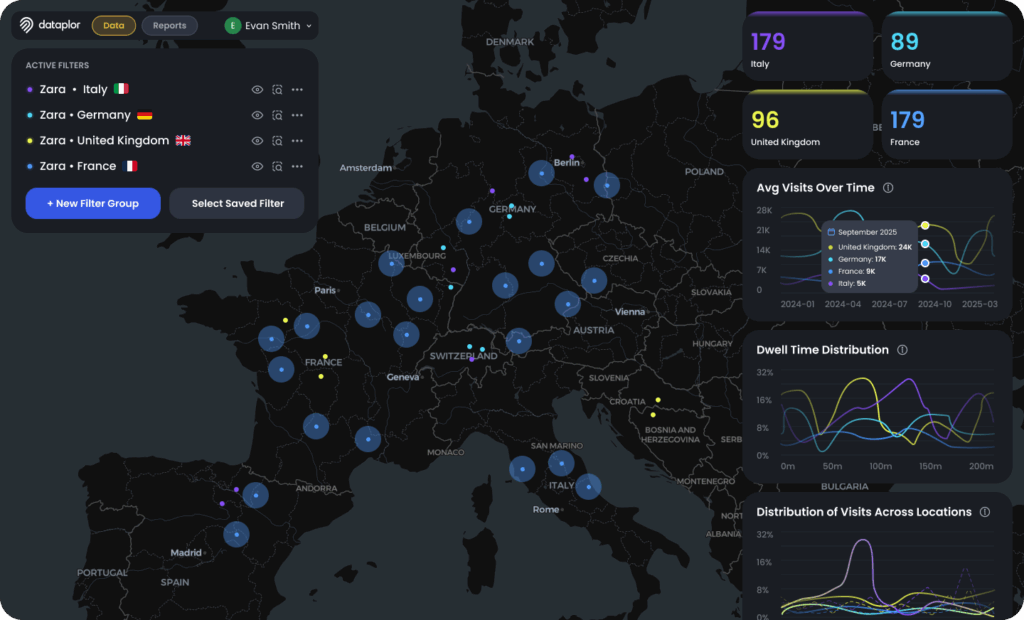
To future-proof global strategies, decision-makers must move beyond high-level assumptions and invest in hyperlocal, multi-source intelligence that reflects how markets actually behave. Dataplor is built for exactly this challenge. Our data is validated through AI and human review, updated weekly, and standardized across markets so global teams can compare regions without reconciling inconsistent sources. We cover merchants and POIs in markets that traditional providers leave blank, and our privacy-safe infrastructure integrates cleanly across CRM, analytics, and planning systems.
The result is local intelligence that scales and gives teams the confidence to expand, compete, and allocate resources wherever opportunity exists. Talk to us today.